I saw a book called the Geometry of Pasta, and decided that it could entertain us today in the math blog. After all, geometry is clearly math. There were several very positive book reviews on Amazon, and one disgruntled review entitled "Another reason to hate geometry."
The reviewer goes on to say, "I was hoping for ... a book that would teach me about the various pastas and how to use them ... the graphic images are artsy, but useless. They are black and white ... look like art deco wallpaper or bed sheets".
Here's a sample. What do you think?
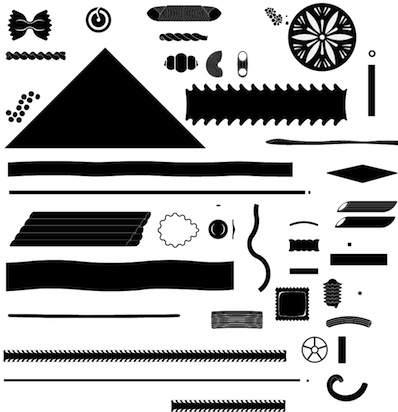
You can take a look at all of the pasta shapes here.
Being a writer and editor, I enjoy reading book reviews, and I think it's fair for a reader to be irritated by images of an item if they don't help connect what an item is (identity / name) to what it looks like (appearance / shape) and what you can do with it (utility / cooking).
If, like me, you grew up without Italian relatives or friends, you may not understand pasta from these pictures. I moved to the page with an alphabetical list of pasta and clicked on BUSIATI. It turns out to be a twisted worm-like shape marked 180 x 10 that's good with Pesto Genovese. I think pesto is a green sauce and Genoa is an Italian town, but I've never had a basic pasta course, and these references baffle me.
(Yes, you are correct. I cannot successfully order pasta in an Italian restaurant.)
Remember last Friday's blog on DysLexia and DisCalculia?
Perhaps I have DisPastalia!
Let's cut through this confusion - here's what we at Excel Math consider geometry:
Identifying shapes by appearance and feel
Identifying straight and curved lines
Finding the inside and outside of a figure
Counting sides and corners
Navigating a maze
Learning terms: parallel, intersecting and perpendicular lines
Learning terms: of plane, figure, polygon, quadrilateral, parallelogram, and diagonal
Learning terms: flat and curved faces, vertices and edges
Learning terms: pentagon, hexagon, octagon and pentagon
Learning terms: rhombus and trapezoid
Recognizing 2-D figures: squares, circles, triangles and rectangles
Recognizing 2-D figures: equilateral, isosceles and scalene triangles
Recognizing 2-D figures: the parts of a circle
Recognizing 2-D figures: right, obtuse and acute angles
Recognizing lines of symmetry
Recognizing 3-D figures: sphere, cone, cylinder, cube,
Recognizing 3-D figures: rectangular, square and triangular pyramids and prisms
Recognizing patterns
Recognizing when figures are similar or congruent
Recognizing movements: flips, turns and slides
Recognizing patterns in a sequence of figures or shading
Sorting shapes by common characteristics
Changing shapes by moving or removing lines
Drawing shapes from verbal descriptions
Creating shapes using pattern blocks
Finding simple shapes within complex patterns
Determining when figures do and do not belong in a set
Determining coordinate points
Determining if coordinate points are on a given line
Measuring line segments to the nearest half inch or half centimeter
Measuring angles
Measuring vertical or horizontal lines by subtracting X or Y coordinates
The sum of the angles for rectangles, triangles and circlesAssociating 360 degrees in a circle with 1/4, 1/2, 3/4 and full turns
Calculating area of a square and rectangle
Calculating perimeters
Calculating volume of a figure with one or more layers of cubes
Calculating the diameter, given the radius
Calculating the volume of a rectangular prism using the formula L x W x H
Calculating area and perimeter given coordinates on a coordinate grid
Calculating the area of a parallelogram
Calculating the surface area of a rectangular prism
Calculating the area of a triangle
Solving word problems involving area and perimeter
That's no doubt more than enough to make you groan or weep. I'll finish with this:
Is the formula for the area of a pizza pie expressed as 2 π r, or is it π r²?
Monday, November 8, 2010
Friday, November 5, 2010
Dyscalculia
I saw a word for the first time today. It might have been coined about 35 years ago.
Dyscalculia.
It literally means counting badly, or perhaps in a more politically-correct phrasing, difficulty with calculations - thus resulting in difficulty learning or doing math.
Here are a few things a person with dyscalculia might experience:
Next I read about researchers in Oxford who announced that they've put electrodes on subjects' heads and passed a small electric current through the skin. In more precise terms - transcranial direct current stimulation. With a very small sample (15) group they found when the current is applied in one direction, math skills were enhanced; the other direction retarded math ability.
Here's a drawing of the brain from Wikipedia, with red indicating the area where we think math skills originate. This is where they applied the electrical current. A BBC newsman volunteered to do the same experiment - he reported that he neither felt the electrical stimulation, nor improved in his math abilities. That caused him to raise the question himself "Was there anything in there to be stimulated?"
I think it would be safe to say there needs to be a lot more testing on this concept before we know this has any advantage or utility. And whether it is safe to try it at home. The full report will not be published until later in November.
However, I did see one article which suggested math-test-taking, over-achieving students might try it as an alternative to studying, just as over-competitive athletes take performance-enhancing drugs.
Which would you prefer? Hit the books, or throw the switch?
We could offer an optional electrical adaptor and headset with all Excel Math purchases!
Dyscalculia.
It literally means counting badly, or perhaps in a more politically-correct phrasing, difficulty with calculations - thus resulting in difficulty learning or doing math.
Here are a few things a person with dyscalculia might experience:
- Confusing math symbols: +, −, ÷ and × and trouble with written or mental arithmetic.
- Inability to make change, estimate price totals or balance a checkbook.
- Trouble reading a clock and judging the passing of time, thus arriving late or early.
- Inability to navigate or rotate a map where up is North, to face the direction of travel.
- Inaccurately estimating the size of or distance to an object.
- Inability to read a sequence of numbers, or transposing them (seeing 34 vs 43).
- Trouble counting cards or scoring in sports (such as tennis, bowling).
- Difficulty in activities requiring counting, such as dance steps.
Next I read about researchers in Oxford who announced that they've put electrodes on subjects' heads and passed a small electric current through the skin. In more precise terms - transcranial direct current stimulation. With a very small sample (15) group they found when the current is applied in one direction, math skills were enhanced; the other direction retarded math ability.
Here's a drawing of the brain from Wikipedia, with red indicating the area where we think math skills originate. This is where they applied the electrical current. A BBC newsman volunteered to do the same experiment - he reported that he neither felt the electrical stimulation, nor improved in his math abilities. That caused him to raise the question himself "Was there anything in there to be stimulated?"
I think it would be safe to say there needs to be a lot more testing on this concept before we know this has any advantage or utility. And whether it is safe to try it at home. The full report will not be published until later in November.
However, I did see one article which suggested math-test-taking, over-achieving students might try it as an alternative to studying, just as over-competitive athletes take performance-enhancing drugs.
Which would you prefer? Hit the books, or throw the switch?
We could offer an optional electrical adaptor and headset with all Excel Math purchases!
Thursday, November 4, 2010
Are we math-rational?
It seems like Math should be able to help when you have to make a go/no-go decision.
Here are some examples:
Your car needs repairs. The garage's estimate approaches the value of the car. The car is 10 years old, runs ok, but needs $3500 worth of work on a variety of systems - do you give the car away, sell it as is, drive it until it breaks down, or fix it? How do you decide?
You install some new software. It doesn't work like you thought it would. Do you uninstall it, lose the value of the cash you spent (not returnable) and your time for installation - then go back to the old way? How do you determine the best option?
You buy a ticket to a concert. You then remember an important family event on the same date. Do you throw away the concert ticket, try to resell it, give it to a friend, or ignore the family event and go to the concert anyway, knowing you will "pay the price" for it later?
You buy a house in a nice area and you it. But the market is down, you owe far more than it's worth, you're struggling to make the payments and you discover you can rent a similar house down the street for much less. Do you hand the house back to the bank, do you take in a renter, or just gradually go broke?
You own stock in a company that is struggling. It's done well in the past but you are beginning to doubt that it will appreciate in value or pay its dividends. Do you sell? Hold? Ignore?
Does math help us in these situations? In general, based on 50 years of experience, I'd say It's seldom any help.
Why? Too many considerations in each of these decisions are not mathematical.
I'll explain - many decisions are made in a logical manner, based on rational evaluation of the evidence. But in many other cases we are intuitive, or emotional; the options are not easily compared, and we don't have numerical criteria that can be mathematically evaluated.
I know about car-buying decisions because I worked in automotive publishing for 25 years. No matter how much comparison information you give people in advance, they often as not will choose whatever they want on the day they go shopping. Not what they said they would buy.
I had the chance to drive a Tesla, the electric sportscar. It was red; it was fast; it didn't handle as well as my current car. I didn't like it; I certainly didn't need it. After my drive the Tesla salesman asked me what car I thought I would buy next. Based on my whims, my shopping habits, and my needs, I said "A Ford Transit Connect."
He was stunned - "That's $20,000! It's a mini-truck! A commercial vehicle!" That's right. Nothing at all like his product, but certainly a usable option for me and one I liked better than his fast little electric sportscar.
But not rational. Not mathematical.
I'm not suggesting math can't be involved in some decisions - it's just not useful in 37.78% of decisions (yes, I made that up).
Here are some examples:
Does math help us in these situations? In general, based on 50 years of experience, I'd say It's seldom any help.
Why? Too many considerations in each of these decisions are not mathematical.
I'll explain - many decisions are made in a logical manner, based on rational evaluation of the evidence. But in many other cases we are intuitive, or emotional; the options are not easily compared, and we don't have numerical criteria that can be mathematically evaluated.
I know about car-buying decisions because I worked in automotive publishing for 25 years. No matter how much comparison information you give people in advance, they often as not will choose whatever they want on the day they go shopping. Not what they said they would buy.
I had the chance to drive a Tesla, the electric sportscar. It was red; it was fast; it didn't handle as well as my current car. I didn't like it; I certainly didn't need it. After my drive the Tesla salesman asked me what car I thought I would buy next. Based on my whims, my shopping habits, and my needs, I said "A Ford Transit Connect."
He was stunned - "That's $20,000! It's a mini-truck! A commercial vehicle!" That's right. Nothing at all like his product, but certainly a usable option for me and one I liked better than his fast little electric sportscar.
But not rational. Not mathematical.
I'm not suggesting math can't be involved in some decisions - it's just not useful in 37.78% of decisions (yes, I made that up).
Wednesday, November 3, 2010
Time Crawls When You Are Watching the Clock
Yesterday I read about artist Christian Marclay's creation of a 24-hour movie, called CLOCK. He has assembled it from thousands of clips from 3000+ movies that have clocks that indicate the time of the action going on. He has been working on the project for 2 years, and has a team of 6 people just watching movies, looking for scenes with a clock or watch. Read more about it here.
So when you walk in the gallery in London and look at the screen, some actor is up there doing their bit with a clock on the wall that matches the real time of day. Here's a typical scene that he selected:
This CLOCK concept appealed to me, because I recently watched the 50's movie The Ladykillers and noticed the focus held on this nice watch in one scene. The bad guys were synchronizing their watches before robbing a train.
Since math class is where we teach kids to tell time, using digital or analog clocks and watches, for today's blog I decided to make my own sequence of time. This is much easier than Marclay's task, as I could take still photos of clocks that are scattered around our offices. And I didn't plan to take 1440 shots (24 hr x 60 min = 1440).
While I was doing it, our power went out! Most of the clocks run on batteries, so they're ok, but the computer doesn't do so well without electricity. So I had to go home early and finish on another machine. Here's my mini-art project:
So when you walk in the gallery in London and look at the screen, some actor is up there doing their bit with a clock on the wall that matches the real time of day. Here's a typical scene that he selected:
This CLOCK concept appealed to me, because I recently watched the 50's movie The Ladykillers and noticed the focus held on this nice watch in one scene. The bad guys were synchronizing their watches before robbing a train.
Since math class is where we teach kids to tell time, using digital or analog clocks and watches, for today's blog I decided to make my own sequence of time. This is much easier than Marclay's task, as I could take still photos of clocks that are scattered around our offices. And I didn't plan to take 1440 shots (24 hr x 60 min = 1440).
While I was doing it, our power went out! Most of the clocks run on batteries, so they're ok, but the computer doesn't do so well without electricity. So I had to go home early and finish on another machine. Here's my mini-art project:
Tuesday, November 2, 2010
Curvacious
When regular people talk about curves, they usually are thinking of people who are "traditionally-built", like Precious Ramotswe, the No.1 Lady Detective in Botswana.
(If you don't know her, go to a bookstore or check your video sources. I promise you won't be disappointed.)
Alternatively, they may have a winding road in mind:
When mathematicians talk about curves, they are referring to lines that can be defined using a math formula.
I found a website this weekend - 2D Curves - that shows 874 different types of curved lines, and explains how they are created.
People ask me how I can find this strange stuff on the web. Well, in this case I was looking at a new Cartier watch, on which the "Durer's Folium" curve resides. The second hand travels that weird shape in the middle, rather than just spinning around an axis:
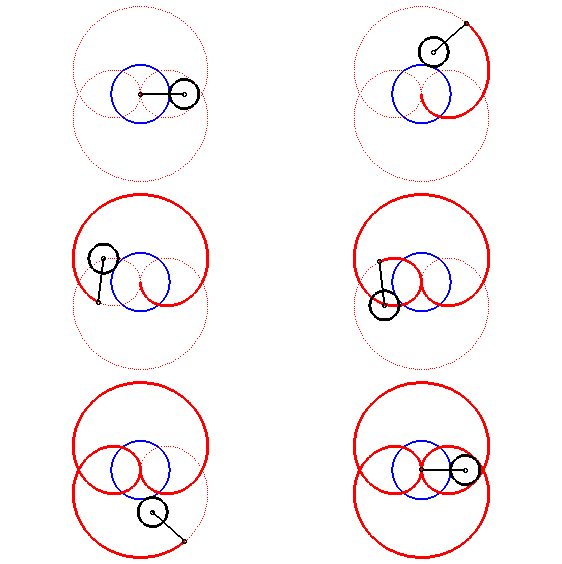
I had no idea what a "Durer's Folium" curve was, so I went on a quest. Here's an animated illustration of what I found:
If you understand French, you can read the MathCurve site where this image originated. They generously gave me permission to reuse this animation. (See yesterday's blog.) If you don't know French math terminology, you can still enjoy the other graphics and animations you'll find there.
When we talk about curves in school, we often mean a "Bell Shaped Curve" which represents a distribution of test scores. The technical name for this curve is the Probability Density Function. Here's one:
Do we teach this in Excel Math? Yes and No. We do teach how to plot lines on a grid, but we don't quite reach the level where students are doing algebraic calculations of curves.
(If you don't know her, go to a bookstore or check your video sources. I promise you won't be disappointed.)
Alternatively, they may have a winding road in mind:
When mathematicians talk about curves, they are referring to lines that can be defined using a math formula.
I found a website this weekend - 2D Curves - that shows 874 different types of curved lines, and explains how they are created.
People ask me how I can find this strange stuff on the web. Well, in this case I was looking at a new Cartier watch, on which the "Durer's Folium" curve resides. The second hand travels that weird shape in the middle, rather than just spinning around an axis:
I had no idea what a "Durer's Folium" curve was, so I went on a quest. Here's an animated illustration of what I found:
If you understand French, you can read the MathCurve site where this image originated. They generously gave me permission to reuse this animation. (See yesterday's blog.) If you don't know French math terminology, you can still enjoy the other graphics and animations you'll find there.
When we talk about curves in school, we often mean a "Bell Shaped Curve" which represents a distribution of test scores. The technical name for this curve is the Probability Density Function. Here's one:
Do we teach this in Excel Math? Yes and No. We do teach how to plot lines on a grid, but we don't quite reach the level where students are doing algebraic calculations of curves.
Monday, November 1, 2010
How fast can you write a blog?
I've been asked how hard it is to blog about math.
Is it Hard? or Not Hard?
My daily blogging can take from 30 minutes to 4 hours. Most of the time, it's not as hard as writing math curriculum!
IDEA
First I have to come up with an idea. A concept. It could be a family or group of concepts, such as fractions, ratios, division, etc. This is blog 311 for me and I haven't run out of ideas yet. It's best to think 3-4 days in advance but I seldom do that unless I am going on vacation or a business trip and have to write many blogs in one day.
Last Friday it was "How many gallons of water have we put down this sink in the last 60 years? (which made the drainpipe get so clogged up!)"
Today the topic "How Fast ..." is my alternate, because the primary topic got stalled (more on this later).
WRITING
After I have an idea I start writing. Full speed, straight out. I start throwing words at the screen. This is the easiest part of the job for me. I have been writing daily at work and home, for over 40 years. I hope it shows.
ILLUSTRATIONS
I think a lot about the illustrations, which are very important in my blogs. In many cases I take the pictures myself, so I may be wandering around our offices or the streets, looking for good subjects.
Photo: Here's a typical photo I took with a tripod and timer. I'm wearing the cat face; my wife is the goat (not dog). This was used to show the range of colors that your eyes can distinguish. Naturally we had to get the shirts, the background set up, the photo in focus, etc. I have taken about 50,000 photos, and they're all on my hard drive:
Is it Hard? or Not Hard?
My daily blogging can take from 30 minutes to 4 hours. Most of the time, it's not as hard as writing math curriculum!
IDEA
First I have to come up with an idea. A concept. It could be a family or group of concepts, such as fractions, ratios, division, etc. This is blog 311 for me and I haven't run out of ideas yet. It's best to think 3-4 days in advance but I seldom do that unless I am going on vacation or a business trip and have to write many blogs in one day.
Last Friday it was "How many gallons of water have we put down this sink in the last 60 years? (which made the drainpipe get so clogged up!)"
Today the topic "How Fast ..." is my alternate, because the primary topic got stalled (more on this later).
WRITING
After I have an idea I start writing. Full speed, straight out. I start throwing words at the screen. This is the easiest part of the job for me. I have been writing daily at work and home, for over 40 years. I hope it shows.
ILLUSTRATIONS
I think a lot about the illustrations, which are very important in my blogs. In many cases I take the pictures myself, so I may be wandering around our offices or the streets, looking for good subjects.
Photo: Here's a typical photo I took with a tripod and timer. I'm wearing the cat face; my wife is the goat (not dog). This was used to show the range of colors that your eyes can distinguish. Naturally we had to get the shirts, the background set up, the photo in focus, etc. I have taken about 50,000 photos, and they're all on my hard drive:
Clip Art: Here's an image assembled from clip art from my publishing archives. I have licensed the use of 750,000 images in order to have the raw material to make something like this - a man gazing into a crystal ball and seeing old ladies in the future. His mom, or wife perhaps?
Mixed Media: This is a compilation of a photo taken of a blueprint and a ruler taped to my whiteboard. It demonstrates how scale drawings work. In hindsight, it's boring.
Here's another compilation of text and graphics to help show how fuel economy calculations vary from country to country.
Permissions: As you can imagine, it takes time to find and construct graphics. It would be nice to just be able to think of a picture and have it appear on my page. That's sometimes possible using a source like Wikimedia that generally allows reuse, but in most cases it's considered bad form to borrow art without asking for permission. There are lots of exceptions but it is better to ask than to reuse (steal) artwork.
(This is why I have an alternate blog topic today - I want to use some art for another topic but I need to wait for a reply to my request for permission.)
EDITING and PREVIEWING
After the blog is written I have to make sure it looks good and it's grammatically and mathematically correct. This is sometimes difficult, as I write and edit most of my own material. My wife reads it every night so there may be midnight corrections at times!
If you are using a browser like Firefox or Safari, I have checked its appearance for you. If you read this with an RSS feed, then most of my layout work is discarded (sigh!) and you see text with art without much formatting.
For example the headings in this post are bold and red. I do this formatting stuff last. If the post is going to contain multi-colum tables, animated GIFs, embedded YouTube videos, etc. I have to be careful and it takes much longer to make sure all the HTML coding works. Yes, there is code in this. It's a computer!
POSTING
I use Blogger to write, post and host this blog. Blogger is fairly reliable. A couple months ago Blogger started NOT working with Firefox and I was unable to determine why. Not wanting to mess up all my other inter-related accounts with Google, I switched to Safari to write all the blogs. In the last week, Firefox seems to be working again. Today I am using Safari.
READ
Finally I post the blog and read it. Unlike artists who perform a song then never listen to their own albums, I like to read what I write. What fun would it be to create something you don't enjoy?
BACKUPS
Believe it or not the "blog in the clouds" is not invulnerable. We have to back up our own work. I download the whole blog every couple months and save it on my drive and to an optical disk.
Subscribe to:
Posts (Atom)