Additional Math Pages & Resources

Wednesday, January 30, 2013

Super Bowl XLVII in the Math Class

This Sunday marks another highlight of the football season for couch potatoes and sports fans alike as the San Francisco 49ers get ready to battle the Baltimore Ravens in New Orleans. As your students choose teams, get out their football jerseys, stock up on snacks and follow the coverage online, opportunities abound for including math in the pregame excitement.

Even for students who don't especially enjoy football, Super Bowl ads have become a much-talked-about part of the weekend. Online previews and advance clips give everyone a chance to weigh in on the best and the worst ads of the year. You can use these ads to have your class calculate cost per second of ad time, create tables and graphs to show which students plant to watch which ads, evaluate which advertised products give the best value for the buck, etc.

In Excel Math, we help students build confidence in math with proven lessons that really work. Take a tour of our program or watch an overview video to see it in the classroom: www.excelmath.com.

As part of your student's Super Bowl experience, you can have students plot the geographical course to get a mythical relative from one part of the country to New Orleans for the Super Bowl, stopping to visit war memorial sites, parks and national monuments on the way. Students can calculate distance traveled per day, expenses (including hotel and food as well as gas money), and  how long it would take to get from the starting point to New Orleans if they traveled so many miles per day. They can research and write mini reports, and even keep a travel log or create a tourist brochure complete with photos and money-saving tips for the savvy traveler.

Students can create video ads and online presentations highlighting some of the landmarks in your own city and state along with statistics to encourage visitors from around the country to travel to your town. You could create a contest where the top three ads or travel brochure presentations created by students in each class would be featured during your own classroom football (or math) bowl next week.

If your students aren't sure how to tell which Super Bowl this is, help them decipher Roman numerals with suggestions from our previous blog post: Roman Numerals and the Olympics. Then ask them to write the correct Roman numeral for the fiftieth Super Bowl in 2016 (L) and the thirty-first Olympics that same year (XXXI).

Some teachers create Super Bowl games with math facts and equations to challenge students while helping them realize that math can be fun. The state of Washington has created a list of basic football facts plus a downloadable football field you can use (and modify) as a game board for your class: http://www.k12.wa.us/CISL/EliminatingtheGaps/TeacherToolkit/footballmath.aspx
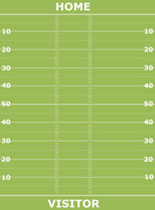
Football Game Board
You can print a football game board for each student in your class, and use the boards to help students add, subtract, divide, multiply, count by tens, etc. Younger students can change the board to mark 1-10 on the yard lines rather than 10, 20, 30, 40, 50, etc. You can also subdivide the yard lines to have students count by fives. Give each student a paper football shape (use the image on the right or from the PDF file provided by Baltimore Country Public Schools below) along with the game board. Cut additional football shapes and print math equations on them to review the basic facts your class is learning.


Place the equations in a box or basket. Have a student choose a football equation (without looking at it). Read it aloud to the class. Let your students move their football to the correct yard line for the answer (or have them use their electronic response systems to click in with their answers. Each student who answers correctly can advance down his own field 10 yards. Continue until at least one student reaches the end of the field. Give those students a bonus equation to solve for the extra point.

In addition to equations, try some of these football math questions to create your own math game: http://school.familyeducation.com/math/family-learning/37542.html

The Baltimore County Public Schools have put together a complete PDF file with instructions and handouts for creating your own football math game. Students receive a paper helmet (included in the file) each time they score a touchdown: http://www.bcps.org/offices/dpd/pdf/Football-Math-Game.pdf.

If you prefer computer games, here's one for football fans: http://www.funbrain.com/football/. No knowledge of the rules of football is required. Students can practice addition, subtraction, multiplication and division (or any combination of the above) with opportunities to us decimals and algebra (or not) as they move the football down the field toward a touchdown.

For practice adding and subtracting positive and negative integers while moving down the football field, try http://www.mathgoodies.com/games/integer_game/football.html. You'll need to remind your students that each new equation begins where the arrow indicates, not at zero.

The National Council of Teachers of Mathematics has pulled together three math lessons involving  football: http://illuminations.nctm.org/LessonDetail.aspx?id=U85 to help your students with number sense, geometry, measurement, statistics, estimations, and problem solving.


Excel Math lessons help students develop a love for math as they build confidence, master mathematical concepts, and build a life-long foundation for using math in everyday life.

New to Excel Math? Learn more here. Then take a look at our sample lessons.

Have additional football math suggestions? Leave a comment in the box below.

Monday, January 28, 2013

We're Number One: Benford's Law


Did you know? The digit 1 occurs much  more frequently as a first digit in our lives than the other digits. Just take a look at the first digit of bank account numbers, income statements, grocery receipts, restaurant tabs, tax forms and any other area of life where  lists of numbers occur.

Statistically, we would predict the digit 1 to occur as the first digit in a list of numbers one out of nine times or 11.1%. But instead, the digit 1 tends to occur in tables, listings, and statistics with probability ~30%, much greater than we would expect. This phenomenological law is called Benford's law, the first digit law, first digit phenomenon, or leading digit phenomenon.

Not every student will become a mathematician or develop an interest in Benford's law, but all can learn to view math as something useful to everyday life. Schools across the nation that use Excel Math consistently report improved test scores. Many graduates of Excel Math tell us math is now their favorite subject. See how Excel Math can help your students at excelmath.com.
Benford's law was first published in 1881 by the astronomer Simon Newcomb. It is named for the late Dr. Frank Benford, a physicist at the General Electric company. In 1938 he discovered, after examining tables of logarithms, that the first pages were much more worn and smudged than later pages.

A logarithm is an exponent. Any number can be expressed as the fractional exponent—the logarithm—of some base number, such as 10. Published tables let us look up logarithms corresponding to numbers, or numbers corresponding to logarithms. But logarithm tables (remember the old slide rules derived from them?) are no longer used much for calculating. Calculators and computers are easier and faster. But logarithms remain important in many scientific and technical applications, and they were a key part of Dr. Benford's discovery.

Dr. Benford concluded that it was unlikely that physicists and engineers had some special preference for logarithms starting with 1. He therefore began a mathematical analysis of 20,229 sets of numbers, including the areas of rivers, baseball statistics, numbers in magazine articles, random samples from a day's stock quotations, a tournament's tennis scores, the numbers on the front page of The New York Times, the populations of towns, and electricity bills in the Solomon Islands, to name a few. All these seemingly unrelated sets of numbers followed the same first-digit probability pattern as the worn pages of logarithm tables suggested. In all cases, the number 1 turned up as the first digit about 30 percent of the time. Read more at http://www.rexswain.com/benford.html

It doesn't seem to matter whether the numbers are based on the dollar prices of stocks or their prices in yen or marks, nor does it matter if the numbers are in terms of stocks per dollar. As long as there are enough numbers in the sample, the first digit of the sequence is more likely to be 1 than any other. Read more at
http://mathworld.wolfram.com/BenfordsLaw.html

In general, this first digit law says that the probability of the first digit being a "d" is

This formula suggests that the number in a table of physical constants is more likely to begin with a smaller digit than a larger digit. Read more at http://www.mathpages.com/home/kmath302/kmath302.htm

Since most people aren't aware of this phenomenon, it has been used to help detect fraud. Software companies have developed detection software based on Benford's Law. The income tax agencies of several nations and several states, including California, are using this software, as are a score of large companies and accounting businesses. Benford's law is even used in "Statistics forensics" to help bring criminals (such as embezzlers, tax evaders, frauds and even sloppy accountants) to justice. Learn more about fraud detection at http://www.kirix.com/blog/2008/07/22/fun-and-fraud-detection-with-benfords-law/


New to Excel Math? Learn more and view sample lessons on our website: excelmath.com.

Tuesday, January 22, 2013

Connecting Classroom and Home

Student success begins at home—or at least it would in an ideal world. So what can educators do to make the home/school connection a smooth one?

Some parents and students hear the word math and cringe. But often they forget how much math they already use each day. One way to help students overcome math anxiety is to focus on opening the lines of communication with their parents and caregivers.

You can see additional suggestions for helping students succeed at math on our previous blog post, 7 Steps to Successful Math Students (and Parents). Having supportive parents can go a long way to reducing math anxiety in students.

Excel Math Parent Letter
Click here to view
Keeping communication lines open with adults can help alleviate their own anxieties about school, math, and raising children in today's fast-paced world. Since Excel Math has a unique way for students to check their own answers, we provide a letter of explanation especially for parents. This letter explains our CheckAnswer system and asks parents to commit to working with and helping their student with math homework. The letter is available in English and Spanish; click here to view and download it.


According to recent studies, the more engaged adults become in their child's education, the greater the chances that child will succeed. When students feel supported, their confidence grows and they become self motivated.  We've pulled together some resources from the National Council of Teachers of Mathematics and our own Excel Math website to help you get the conversation started with parents and other adults involved in the lives of your students.

If you have a new student enter your math class mid-year, use the Excel Math Placement Test (in English and Spanish) to determine which grade level the student is ready to begin. Since Excel Math is available in Individual Student Sets (in a tablet form) for just $19.00 per student for the year, it's easy to customize the learning experience for new or transfer students. Classroom sets of Lesson Sheets (loose sheets in class sets of 10, 15, 22, 30 or 35) are even more cost-effective at only $11.00 per student for the entire year.

Click on the links below to access these resources:
The following links include tips and helps especially for families. These PDF files are available in English and Spanish. You can print them out for families of your students or simply send the links via email. If you have a class website, you may want to include the links on your own class page:
Have a favorite family or math resource you'd like to share? Leave a comment in the box below.

This week, administrators and educators from around the country are gathering in Nashville for the National Title I Conference. Excel Math will be there, too. If you're looking for some Title I resources, check out our recent blog posts here. Be sure to stop by Booth #521 at the Opryland Hotel and say hello to Bob and Brad.

New to Excel Math? Learn more and view sample lessons on our website: excelmath.com.

Thursday, January 17, 2013

Title I Math Resources, Part II

Excel Math has been used as a proven method for teaching mathematics in Title I programs (both as a supplement and in a core position) for years. These unique Excel Math lessons give teachers the resources they need to help every child succeed and achieve (at high levels) in elementary mathematics.

One of the unique features of Excel Math is the page layout. Because the lesson sheets come as individual sheets rather than as a bound textbook, there is no need for students to take additional class or homework time to copy problems. As a result, they can spend more time on task. The lesson sheets are complemented with hands-on activities, Stretches (brainteasers),  manipulatives, and suggestions for teaching students mathematics in the ways they learn best.

Since Excel Math concepts spiral back on a regular basis (through spaced repetition), there is no need for students to achieve mastery the first time a concept is taught. This mixture of math problems reviewed during Guided Practice and Homework plus gradual spiraling help all students to succeed. Ability groupings can be used at the teacher's discretion, but are not necessary.

If a student seems overwhelmed by the amount of problems on a page, the page can simply be folded in half or quarters (or into even smaller segments). A sheet of paper can be clipped over the problems to tackle later, helping the student focus on the concepts at hand and minimizing distractions.

Excel Math Student Lesson Sheet (easy to fold into smaller sections to help students focus on a few problems at a time)
Projectable Lessons in action
Projectable Lessons on CD-ROM allow the teacher and students to focus together on the instruction. Multiple slides for each lesson of the day provide a visual demonstration of the lesson projected onto a whiteboard, wall, screen or electronic board.

Slides display concepts from the Lesson Sheets, with plenty of space for students to write the answers. Subsequent slides display the answers. These PDF files can be used with any computer or with an overhead document projector as shown on the right. Below is a slide from one of the projectable lessons with space for the students to show their work for problems 2-5.

Projectable Lesson Side from Excel Math
Excel Math also provides reasonable priced, highly informative Professional Development. Bob's seminars focus on proven strategies, practical suggestions and best practices for teaching math to elementary students of varying interests and abilities. He'll guide you step by step through each component of Excel Math: Lesson of the Day, Guided Practice, Homework and regular Assessments, sharing solutions that have worked for other teachers around the country.(Read more about PD here.)


In addition to Professional Development, Title I monies may fund:
  • Programs for low-achieving math students
  • Supplemental math curriculum materials
  • ECE math instruction
  • Parent education in assisting their Title I students in learning math
  • Math Coaches
  • Extended Day Programs
Click here to download
Free Excel Math Placement Tests in English and Spanish can help ensure that students start at the level where they are most likely to succeed. The curriculum is designed with distributed practice so the students are assessed frequently.

Tests are a regular component of the Excel Math Student Lesson Sheets. Each test includes a corresponding table in the Teacher Edition so you can see at a glance which test problems reflect which concepts and objectives. The table includes lesson numbers where those concepts are first taught. These tables are especially helpful if you want to review one or two specific lessons with individual students or with the entire class.


Not every student will become a mathematician, but all can learn to view math as something useful every day. Schools across the nation that use Excel Math consistently report improved test scores. Many graduates of Excel Math tell us math is now their favorite subject.

Click here to download

Specialized "Tools for Teachers" on the Excel Math website give teachers added resources for communicating with parents, keeping track of student achievement, and streamlining class records. Download this Parent/Teacher Conference record to document individualized notes and suggestions for students and their parents. These record forms can be copied for parents (and for the student's record) or saved and emailed as a follow-up to your parent conferences.

Additional Title I resources were included in our previous blog post. Read about them here. Then visit the Excel Math website for more free reproducibles, and get started using them today.

Be sure to leave a comment below if you know of other Title I resources we should include in future posts.

New to Excel Math? Learn more by visiting our website: www.excelmath.com or give us a call at 1-866-866-7026. When you call between 8:30 a.m. and 4:00 p.m. Monday - Friday (West Coast time), a helpful person will answer the phone (never a machine).

Wednesday, January 16, 2013

Title I Math Resources That Work

This weekend, administrators and educators from around the country will gather in Nashville for the National Title I Conference. Excel Math will be there, too. Be sure to stop by Booth #521 and say hello to Bob and Brad.

Title I is the nation’s largest federally funded pre-college education program. It is the cornerstone program of the Elementary and Secondary Education Act, providing more than $19 billion to the nation’s school districts to supplement the education of disadvantaged children. Title I funds pay for curriculum materials, professional development services, resources to increase family involvement and many other educational purchases. (Read more about Excel Math Professional Development here: cost effective, targeted, professional and informative.)

Excel Math has been effectively used in Title I programs (both as a supplement and in a core position) for years. The Excel Math lessons give teachers the resources they need to help every child succeed and achieve (at high levels) in elementary mathematics.

Here's what one principal told us recently about how well Excel Math worked in his school:
“We wanted to let you know that Robbinsville Elementary school was awarded the title School of Distinction during the 2011-2012 school year. We were recognized, in large part, as a result of high math scores—96 percent of 4th graders passed the state end of grade exam! Thanks to Excel Math for helping our students succeed in math."
— Shane Laughter, Principal, Robbinsville Elementary School

Click here to download the report.
Download the Excel Math Scientific Research Report to see how test scores improved at Robbinsville and other schools around the country when they switched to Excel Math. 

One of the great benefits of Excel Math is that it is continually enhanced. We print Excel Math throughout the year so you will always have the latest lesson sheets, unlike textbooks, which are static until you buy a new book.

Excel Math is fully aligned to the Common Core Standards (CCS). Visit our website to view and download correlations by grade level: www.excelmath.com/downloads/state_stds.html

The following chart shows how the new Common Core Standards progress through the grade levels. Another benefit of using Excel Math is that we begin preparing students for fractions and probability in second grade. We don't wait until sixth grade (or even third). Lessons become more rigorous over the years as students develop proficiency with concepts introduced in the early grades. As a result, students have a strong foundation for Common Core Standards. Students develop proficiency in mathematics at all grade levels. Click here to download the chart. Excel Math is available for Kindergarten through Grade 6.
Click here to download the Excel Math Common Core Standards chart.
Visit Excel Math at the Opryland Hotel in Nashville for the National Title I Conference beginning January 21 (that's Sunday). Stop by Booth #521 and ask for an Excel Math executive pen.

Or, even better (and my personal favorite) . . . try some chocolate! Bob assured me it's really good chocolate.
Excel Math and chocolate — a winning combination!

New to Excel Math? Learn more by visiting our website: www.excelmath.com or give us a call at 1-866-866-7026. When you call between 8:30 a.m. and 4:00 p.m. Monday - Friday (West Coast time), a helpful person will answer the phone (never a machine).

These links from the National Council of Teachers of Mathematics provide additional Title I resources for teachers, administrators, parents, and caregivers:

Tomorrow we'll take a look at additional resources, including some for families of your students. Feel free to leave a comment below if you have other resources we should include.

Monday, January 14, 2013

Rainbow Math

This double rainbow appeared outside our Excel Math office in San Diego after a brief rain. It actually seemed to be much closer and more brilliant in color than this photo shows.

A rainbow is sunlight spread out into its spectrum of colors and diverted to our eyes by raindrops. Read more from The Center for Atmospheric Research at: http://eo.ucar.edu/rainbows/

Perhaps a simpler definition of a rainbow is a multicolored arc made by sunlight striking raindrops. When sun, shining from behind the viewer, strikes water droplets in front at just the right angle, a rainbow is produced.

A rainbow does not actually exist at a specific spot in the sky. Its location depends on where you're standing and on where the sun is located at that time. It's an optical illusion. The sun must always be behind the person seeing the rainbow, and the air must be both sunny and full of moisture.

You can see rainbows near other kinds of water, including mist, spray, dew, and waterfalls, as well as rain. Some scientists think rainbows may also appear on one of the moons of Saturn (called Titan).

A rainbow shows up as a spectrum of light—a band of colors that include red, orange, yellow, green, blue, indigo, and violet. Roy G. Biv is a popular name used to help students remember the order of the colors in the rainbow's spectrum.

Elementary school students sometimes use a song to help remember the order of the rainbow's colors (from top to bottom, sung to the tune of "Paw-Paw Patch" or "Ten Little Indians"). Sing the first line three times:
Red, orange, yellow, green, blue, purple;
I see a rainbow bright, bright, bright.
Red is on the outer part of the rainbow's arch, while violet is always on the inner section of the arch. Roy G. Biv includes indigo between blue and violet. Actually, the rainbow is a continuous band of colors from red to violet and even beyond the colors that the eye can see.

In a double rainbow, such as the one in our photo, water droplets reflect light twice. You can see faintly in the picture that the top rainbow has the colors of the spectrum reversed. It appears as a mirror image of the bottom colors with red on the bottom and violet on top. Read more about rainbows on www.NationalGeographic.com.

Your more advanced students may be interested in the path of one light ray incident on a water droplet:

As the light beam enters the surface of the drop at A from the direction SA, it is bent  or refracted a little and strikes the inside wall of the drop at B, where it is reflected back to C. As the light beam emerges from the drop it is refracted (bent) again into the direction CE. The angle D represents a measure of the deviation of the emergent ray from its original direction.

Descartes calculated this deviation for a ray of red light to be about 180 - 42 or 138 degrees. The ray shown here represents the ray that has the smallest angle of deviation of all the rays incident upon the raindrop. It is called the Descarte or rainbow ray. Much of the sunlight as it is refracted and reflected through the raindrop is focused along this ray. The reflected light is diffused and weaker except near the direction of this rainbow ray. Read more at http://eo.ucar.edu/rainbows/

In Excel Math, students learn about rays and angles. We help them understand that the angle measure of the whole is the sum of the angle measures of the two parts. Try these exercises to teach your students how to measure angles. Click here to download Excel Math Grade 4 Lesson 70. The student page is available as part of the Individual Student Set (an entire year of lessons—155 lessons—for one student), available for purchase at www.excelmath.com.

Reprinted from Excel Math Grade 4.
Click here to download Lesson 70

This slide from Projectable Lesson 70 shows how we define a "ray." Click here to download slides from Excel Math Projectable Lesson 70:
Excel Math Grade 4 Projectable Lesson 70Click here to download Grade 4 Projectable Lesson 70.

A future post will continue the rainbow math with a fun watercolor wash rainbow project.

Visit us at www.excelmath.com to learn more about Excel Math and see how these elementary math lessons can benefit your students. Still have questions? Take a tour of Excel Math or leave a comment in the box below.

Thursday, January 10, 2013

Principals Praise Excel Math for Exceptional Math Scores

According to recent reports, North Carolina fourth-graders are among the top eight school systems around the world who scored higher than the U.S. national average on international tests of math achievement (from Trends in International Mathematics and Science Study released in December by the National Center for Education Statistics). Read more in The News & Observer (Raleigh, N.C.)

Local school principals and teachers are quick to point out the positive impact Excel Math has had on student test scores in North Carolina (and across the country).
“We wanted to let you know that Robbinsville Elementary school was awarded the title School of Distinction during the 2011-2012 school year. We were recognized, in large part, as a result of high math scores—96 percent of 4th graders passed the state end of grade exam! Thanks to Excel Math for helping our students succeed in math."
— Shane Laughter, Principal, Robbinsville Elementary School

This chart from the North Carolina Department of Public Instruction shows how fourth graders at Robbinsville Elementary improved in math after using Excel Math lessons. (In contrast, reading scores have gone down slightly. Despite regular requests from educators, Excel Math only offers math lessons—not reading or language.) Read more math success stories on our website.
Robbinsville Elementary Math Test Score Improvement After Using Excel Math.
Click here for a larger view.

In Mitchell, North Carolina, Dr. Beth Bell wrote to us years ago to report that  Excel Math improved student performance even when used in a supplement position, with another math program used as the core:

“We have used Excel Math as long as I’ve been here. It’s a great program, and we use it in conjunction to our adopted program. We have been a School of Excellence for the past three years and we believe it’s largely due to Excel Math. We love it.”
— Dr. Beth Bell, Principal at Gouge Elementary


In Hickory, North Carolina, John Black wrote to let us know how Excel Math has helped the students at Longview Elementary continue to improve their scores:
"We've been using Excel Math for about 10 years. We were one of the first schools in North Carolina to adopt the program. We are 92% Free/Reduced lunch and 38% ESL students. Our proficiency in reading and math were very, very low about 7 years ago. We're still struggling with reading, but our math scores have gone up, and up, and up."


— John R. Black, Principal

Hickory PS, Longview Elementary School


Independent research reported by the Johns Hopkins University School of Education in Best Evidence Encyclopedia states:

Excel Math is a K-6 mathematics curriculum that focuses on problem solving, integrated lessons, and development of thinking skills. Mahoney evaluated Excel Math in a post-hoc matched study in second and fourth grade classes in six California schools. Students were pre and posttested on the Stanford Achievement Test. There were significant differences controlling for pretests favoring Excel Math in second grade (ES= +0.27)


We are always thrilled to hear how well Excel Math works with students across the country. Download our Scientifically Based Research Report for additional case studies. Ready to start your students on the road to excellence with Excel Math? Visit our website to see just how easy it is to get started. If you homeschool, take a look at this awesome review of Excel Math from homeschool mom Cathy Duffy. The prices are out of date (but only slightly, since we don't raise prices very often). You can still purchase an entire year of Excel Math lessons for just $11.00 per student when you order class sets of 10 or more (and only $19.00 each for individual student sets). Download our current order form here.

Still have questions? Call us  at 1-866-866-7026 from 8:00 a.m. to 4:30 p.m.. Monday - Friday (West Coast time). When you call during those hours, a friendly person will answer the phone (never a machine). Give us a call and see! (Or leave a comment below.)

Monday, January 7, 2013

Take a Tech Break to Help Students Focus

As technology takes up more and more of our students' time and attention, there may be a link between students who have trouble focusing (due to the distractions of electronic devices) and those who have difficulty studying and retaining information. Studies are showing that students who become distracted by technology are not as able to focus on their studies and are more apt to have lower grades.

A report released in November surveying Advanced Placement (AP) and National Writing Project (NWP) teachers, finds that 87% say the internet and digital search tools are creating an “easily distracted generation with short attention spans” and 64% say today’s digital technologies “do more to distract students than to help them academically.” Read more at pewinternet.org.

As a result, some schools are having students take a "tech break." Teachers ask the class to place their electronic devices and tablets face down on their desks and move to a non-technology oriented task for 15 minutes (a tech break), then return to technology for 15 minutes, then take another tech break, gradually lengthening the time they are without technology. In this way, students learn to focus on the task at hand without continually checking facebook updates and instant messages or otherwise being distracted by technology.

Researchers discovered that students who interrupted their home study time (after less than 15 minutes) to check their texts, YouTube or facebook posts, had a lower grade point average than those who could wait 15 minutes or longer. It didn't seem to matter how many times they checked their technology—even once during that 15 minute period had a negative impact on their grades. And having to wait even 15 minutes before checking in with technology, created high levels of anxiety in those students. Anxiety in turn, prohibits learning. Read more at eschoolnews.com.

Excel Math offers teachers an easy-to-use way to give students a break from technology while they learn math skills that will help them compete in tomorrow's workforce. Excel Math is available in classroom sets of lesson sheets so each student gets one lesson sheet every day. The student sheet includes the lesson of the day plus Guided Practice and Homework (and may also include Basic Fact Practice, Stretches or brainteasers, complex word problems and regular assessments). There's no need for students to waste time copying problems out of textbooks. Here's an example of an Excel Math Lesson Sheet for Third Grade (the Homework portion is on the back). The answers are given in the Teacher Edition:
Third Grade Excel Math Student Lesson Sheet
Excel Math Lesson Sheets are an easy way for students to transition from technology to paper and pencil. Just have the students place their tablets or electronic devices face down on their desks (after turning off the sound) so they are not distracted by flashing lights during the tech break. Then give each student a lesson sheet. After presenting a 10-15 minute lesson and having them complete the lesson portion of the sheet, use the Projectable Lesson on your whiteboard to reinforce the concept. For your next tech break, let your students complete the Guided Practice section of the Lesson Sheet. Brain research indicates that having students write down the answer to problems (rather than clicking a mouse or touching a screen) helps move that concept into their long-term memories.


According to a current research, "The most recent nationally representative surveys of the Pew Internet Project show how immersed teens and young adults are in the tech environment and how tied they are to the mobile and social sides of it. Some 95% of teens ages 12-17 are online, 76% use social networking sites, and 77% have cell phones. Moreover, 96% of those ages 18-29 are internet users, 84% use social networking sites, and 97% have cell phones. Well over half of those in that age cohort have smartphones and 23% own tablet computers like iPads." Read more from their report: Millenials Will Benefit and Suffer Due to Their Hyperconnected Lives.

Learn more about Excel Math and how these math lessons can benefit your students. Visit us at www.excelmath.com. Still have questions? Take a tour of Excel Math or leave a comment in the box below.

Thursday, January 3, 2013

New Year Bulletin Board Ideas for the Math Classroom

Click here to download instructions
Now that school is back in session (or will be shortly), your bulletin boards can help display basic fact families or math formulas and add a touch of interest to your math classroom. You can make the bulletin boards interactive by included math problems on the boards and letting your students solve them during your math warm-ups or bell work. For more math warm-up ideas, see our previous post.

Start with a basic bulletin board so you can easily change it to reflect the changing seasons and holidays. If you're short on time, keep the border and background paper the same from month to month or season to season. You may want to place one of the the bulletin board displays on your classroom door so it will catch the students' interest as they enter. If you don't actually have a bulletin board in your classroom, use part of a wall or the back of a filing cabinet. You can even hang math problems and math vocabulary words from your ceiling. 

Some simple seasonal bulletin board ideas from Excel Math are shown below. Click on the links to download patterns for each bulletin board. Use foam or small pieces of folded cardboard to give a 3-D effect to the displays. Be creative with your background paper. Leftover Christmas or Hanukkah (or birthday) wrap, foil, a large piece of fabric, burlap, or wallpaper pieces (check with your local paint store or home design center for old samples) make good backgrounds. Remember, these ideas are just starting points to help you get the creative juices flowing as you begin the new year. Feel free to expand and elaborate on these suggestions to fit your own classroom.

January:
Snowflakes with math problems can hang from your classroom ceiling and windows as well as on your bulletin board. Print out the snowflakes below. Create your math problems or use those given, and use the blank ones to let students add some of their own problems. Give students a chance to solve the problems during their warm-up or bell work time.  


Snowflakes: Click here to download.
Give each of your students a piece of white or sparkly paper and let them fold the papers into triangles. Show the students how to cut small pieces out of the triangles and then unfold them to create snowflakes. (Provide tape for students who get too enthusiastic with the cutting.) Students can add their own math equations to the snowflakes and then trade snowflakes to take turns solving each other's math problems.

Heart Stickers: Click here to
download the PDF file
February:
These small hearts can print on label paper (Avery Round Labels 5293) so they become stickers for your students. Or print them onto sheets of white paper for your students to cut out and tape or glue onto your bulletin board. Let each student write random numbers (a decimal or fraction for older students) on each heart and then combine two or more numbers by multiplying them or adding them together. Have the students record their answers as well as the problem they created. If the student got the answer correct, she can keep a sticker. If she got it wrong, she can add a sticker to the bulletin board to create a heart border. Click here to download the heart page.

March: 
Create a shamrock bulletin board in March as St. Patrick's Day approaches. Use the Excel Math Basic Math Facts section of the lesson sheet or our Timed Online Math Practice or copy the sheet of shamrocks for each student. 

Add your own problems to the blank shamrocks. Have students print the answers on the back and then use them as flashcards. Let students choose a buddy and practice the fact families together. Or have them work individually to improve their scores. 
Shamrock Cards: Click here to 
download the PDF file
To engage your sports fans, have a March Madness Math competition during basketball season (pictured at the top of this post. Encourage students to learn their math facts and then beat their own score to achieve a "personal best" (getting 8 out of 10 or better in a basic math facts worksheet) or to beat their best time, completing a set of math facts as quickly and accurately as possible. 
Basketball Cards: Click here to download 
the PDF file.

Award basketballs (cut from the sheet below) to those students who improve each week. Let the students create their own math facts using the blank basketballs, and add new problems to the bulletin board as you (or they) have time. You can even use some of the blank basketballs to highlight a "math student of the week." Let the most improved or high achieving student print his name on a basketball and post it on the bulletin board near the basket. Use netting from an orange or potato sack or an old soccer or tennis net to give your bulletin board a 3-D effect. Bring in a self-standing basketball hoop and let your students solve a math problem and then attempt a basket using a soft foam ball. Create a free-throw line for a 3-point toss. 

Your students can print two- or three-digit numbers on the smaller balls, turn them face down, and then turn over two at a time to add or multiply together. Let your students play in pairs and see who can be the first to get the correct answer (or have each student write the problem and answer on a blank piece of paper and then compare answers after they've done several problems.

Feel free to share your bulletin board ideas with us. Just add a comment below with your suggestion. If we use it in a future post, we'll credit you and include a link to your website or blog. For additional bulletin board ideas, read our previous posts, "Bulletin Board Ideas for the Math Classroom and Seasonal Bulletin Boards for the Math Classroom.

Find out how Excel Math can work for your students at excelmath.com. Excel Math is fully aligned to the Common Core and to state standards. See the correlations.

New to Excel Math? Learn how to get started.