Additional Math Pages & Resources

Monday, January 30, 2012

Counting Up and Out

The Excel Math blog provides content about everyday events that can best be handled with a knowledge of elementary mathematics. It's brought to you by Ansmar Publishers, home of Excel Math. It's written by ExcelMathMike, the managing editor.

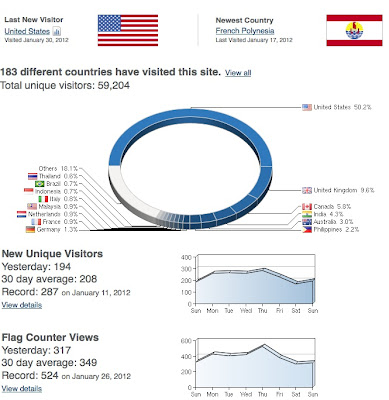
Our blog is monitored by a variety of web user tracking services. They let me know if anyone is reading what I write. The services include FlagCounter, SiteMeter, StatCounter and Google Analytics.

Here are some sample summaries. You can click on the images to enlarge the display. The data tells you a little bit about a lot of people who come by for a short visit. You can see that in the long run, the numbers of visitors are going up.


Why don't the numbers all agree? Because that's the way numbers are. They just don't. 

We have visits per day (whose day? starting when? ending when?), we have page views by"load", by "unique visitors" and by "returning visits". The counters started when I turned them on (or inserted some cryptic HTML code into the page). Since we didn't start them all at the same time, their counts can't be synchronized.

Reconciling inconsistent and incompatible results is the bane of the scientists and researchers. And it's one of the things that we teach kids in Excel Math. Double-check your work (using our CheckAnswer system) and do the problem in several different ways if it's important.

As they used to say on car ads, 

Your mileage may vary.

Starting this week, the Excel Math blog will have a new author. I am retiring after 8 years and millions of math problems. In the past 30 months we've had 100,000+ page views, on about 600 blogs.

ExcelMathCarol is taking my place. Please be kind to her.

PS - I'll still be writing, at Curating Cazalea. Stop by and see me if you have time. Cheers.

Friday, January 27, 2012

Taxes and Fees Revealed, Part II

Yesterday I introduced the subject of taxes and fees, specifically referring to hidden charges on airline tickets. Today we will expand on this subject, using only elementary math taught in our curriculum

About 15 years ago I started a consulting business. I went down to the county government building, created a fictitious name for my business, and got a business license. Because I only had one employee (myself) I only paid $39 for my business license.

Each year I had to pay the $39 but in 2004 the city added a $25 collection "fee" in order to compensate themselves for taking my $39. This applied to landlord licenses, business licenses, etc. They charged us for the work of taking our money, nothing else.

$39 x 1.64 = $64 or a 64% increase over the existing charge!

Outraged small business persons protested and eventually sued the city. The first judgement was in favor of the city, but an appeals court over-ruled and overturned the fee. Click here to read the entire judgement, or skip that and read my summary in plain English:

We must decide whether a 2004 levy imposed by the City of San Diego, without a vote of the electorate, for the purpose of recovering the cost of collecting and administering a general "Business Tax," is a fee or is a special tax that should have been approved by a vote of the electorate. We specifically hold the levy is not a fee, but is a general tax that is subject to voter approval, and is void because it was levied by the city council without approval by a majority vote of the qualified voters as required by the California Constitution. Accordingly, we reverse the summary judgment granted in favor of the City.

We learned that the difference between a tax and a fee is based upon the purpose of the charge:
  • A charge that covers the cost of providing a service to the payer or regulates the payer's conduct is a fee
  • A charge that raises revenue for general spending without conferring any exclusive benefit to an individual payer is a tax.
Notice the careful distinctions made on this summary of airline fees, taxes, charges and surcharges:


In addition to what you see here, you may also pay:
  • Federal 7.5 percent excise tax on the base ticket price
  • Segment tax of $3.70 per person per segment (a single takeoff and single landing)
  • International facility tax of $8.20 per person for flights that begin or end in Alaska or Hawaii
  • A 6.25 percent tax on the amount paid for transporting property (freight, pets) by air

Compared to the airlines, we have an easy time in the book publishing business - but we still have to keep track of the 6000+ municipal and state tax rates in the USA!


Thursday, January 26, 2012

Taxes and Fees Revealed, Part I

PREMISE
"The rich always get taxed at a preferential rate. They have rigged the system, know how to evade taxes, and don't carry their full weight. It's not fair."

We are going to examine taxation without representation today. Specifically, the way that governments and airlines levy taxes and fees on passengers. Thanks to new regulations, airlines must disclose all fees, taxes and other charges. This is excellent for detail-orient, math-saavy shoppers. And it might provide some evidence that the rich pay lower tax rates than the poor. Or not. Let's take a look.


EVIDENCE: CASE STUDY 1
Take a look at this fare breakdown provided by Excel Math's  favorite low-price airline, who shall remain unnamed:

In this case, the fare from San Diego to Providence, RI is $268. Taxes and fees add $67. Divide the fees by the fare to get a 20% "tax" rate for a discounted ticket (bought by a "poor" or frugal person?)


In this case, the fare from San Diego to Providence, RI is $919. Taxes and fees are another $109. Notice the Facility Charge and Security fees are lower for the second flight (did it route through a different intermediate airport?) That's about a 10% "tax" rate for the full-fare ticket bought by a "rich" (or last-minute-emergency) passenger.

EVIDENCE: CASE STUDY 2
The next case shows a non-stop international flight to London. There are lots of extra fees and these do not include baggage, seat upgrades or other discretionary choices by the passenger. It's not shown on this graphic, but the total price in this case was $841 for a restricted coach ticket. The fare was $224 plus fees of $199 and an outrageous fuel surcharge of $418!


If you divide the fees by the fare it's 89% "tax"; if you divide fees by the total (including fuel surcharges), it's a 24% "tax".


Finally, here's a similar international flight to London, in Business Class. We see the "Air Passenger Duty" charge has doubled! This business class, completely flexible and refundable ticket is priced at $11,691 with $10,705 as the fare, plus total taxes and fees of $292 and "fuel surcharge" of $694.

If you divide the fees by the fare it's 2.7% "tax"; if you divide the fees by the total (including fuel surcharges), it's a 2.5% "tax".

CONCLUSIONS
More expensive tickets pay a lower percentage of taxes and fees, but I don't think we can use airline ticket prices to prove the rich are getting preferential "tax" treatment. We can conclude this:

  • Basic fees are a huge proportion of an inexpensive ticket, and a much smaller portion of a high-priced ticket. As a result, they obscure the "nearly free" fare on the first example.
  • We can see that "fuel surcharges" are not equal for every passenger, and not proportional to the fares - are they determined by the square footage occupied by each passenger on the aircraft? 
  • Why does the UK charge a Business Class passenger twice as much to enter the country as a Coach passenger?


Wednesday, January 25, 2012

Full, Fuller or Fullest?

Today I filled my car with gasoline and put 19.660 gallons into an 18.5 gallon tank. How? This is a test for your elementary math.


Please select any answers that apply:
  1. The owner's manual is incorrect (the tank holds more than 18.5 gallons)
  2. The gas pump metering is incorrect (I got charged for more fuel than was delivered)
  3. Some of the fuel leaked onto the ground or elsewhere out of the tank
 I am happy to report that any of these, and many other reasons may apply. Let's take the 3 choices one by one.

1. Technically the owner's manual is correct, BUT the tank does hold more than 18.5 gallons. All fuel tanks on US motor vehicles have an expansion space that accomodates fuel expansion and vapors. This ranges from 10-12% of the total space of the tank, so my car might have an extra 2 gallons or so of space. Normally this does not fill with fuel, due to automatic shut-off valves that sense when the tank is nearly full. I was holding the handle to fill it up, and the pump did not stop.
I know a bit about fuel venting, because in a former career, I created products like Mitchell Automechanics and an Emission Control Training Manual, and other fascinating books that deal with automotive evaporative control systems (they keep fuel vapors from polluting our air).

2.  The station I filled up at was using a pump that does not adjust volume to compensate for temperature variations. A label on the pump says "This device dispenses gasoline solely by volume measured in standard gallons (231 cubic inches). It does not adjust for temperature or other factors which may affect the energy content of each gallon dispensed."   

This means I should have received an accurate number of gallons, but I might not have received the full amount of energy that is contained in fuel at the standard 60 degrees F. My fuel may have been hotter or colder (holding more or less energy) than I expected. This is a complex subject to grasp - visit this site for a clear (if long) explanation.

Alternatively, the pump might have been defective and dispensing the incorrect amount of fuel. But it's unlikely, as they are frequently checked.

3. Some of the fuel did leak out of the tank and land on the ground. Not much, but a little. Let's say 3-4 ounces (half a cup), or a small fraction of a gallon. It also spilled down the side of the car and stained the plastic trim. The attendant at the station hosed down the fuel spill and gave me some wipes to clean the car. I didn't take a picture of the spilled fuel, but the car looks OK.


Let's end with a simple question:

Is it possible to fill a container with more than it was supposed to contain?

Yes. Absolutely. We prove this every Thanksgiving meal when we eat more than we should!

PS You might wonder if the fuel tank can expand and contract like your stomach does. To a limited extent, yes, it can change its shape and volume when subjected to enough pressure or vacuum.

Tuesday, January 24, 2012

Over-under-mis-use of health care

I saw an interesting study today that reported on overuse of health care in the United States. I wonder if any of us "over-use medical resources". What do you think? What does this mean? How can it be measured? Does it mean we are too healthy?

And why is this a topic for the math blog? We define under, over, middle and similar terms on the first day in Kindergarten; these are fundamental concepts in math education.

It turns out the researchers defined their terms like this:
  • underuse is the lack of providing necessary care
  • misuse is the provision of wrong care or medical error
  • overuse is using medical services with no benefit or where harm outweighs benefit
Underuse seems to happen most often with lower income or English as a second language patients. It means people don't get medication that could prevent a heart attack, or an assistance device that could reduce injury.

Misuse includes unnecessary procedures, incorrect medication or gross error.

The researchers identified 172 articles from 1978 to 2009 that measured the rates of overuse of procedures (53 studies), diagnostic tests (38 studies) and medications (81 studies), then examined the use of 18 therapeutic procedures and 24 diagnostic services.  

For preventive services, overuse rates ranged from 7% to 61%. Cancer screening overuse varied from 8% to 61% for screening colonoscopies. Prostate cancer screening using PSA was 16% to 36%. Cervical cancer screening reported that 58% of those screened should not have been. The overuse rate of mammography diagnosis was reported to be 30%.

For medications, antibiotics for upper respiratory tract infections (URI) were the most commonly studied. The overuse rates for antibiotics for URI ranged from 2% to 89%.

What's the harm in testing a bit too often? Won't we find problems sooner?

Not necessarily - there are significant risks:
  • Risks directly related to the test, such as the radiation exposure caused by imaging tests
  • Risk of a false positive, leading to mental anguish and unnecessary follow-up tests and procedures, each with its own set of health hazards
  • Risk that a condition will be identified that is not harmful but now will be treated
Although there are enormous costs associated with overuse (estimated as high as $200 billion a year, or 10% of total healthcare expenditures), there are also personal costs. Remember, testing is a very specific and personal matter. Some patients want to be absolutely sure; others can live with less information (what I don't know won't hurt me). There are no hard-and-fast rules for which tests are needed in each situation.

The reasons and motives for under- and over-utilization are murky. Liability and malpractice suits drive doctors to do more tests, for example, as does peer pressure among patients (Have you have a body scan yet, darling?). We really don't understand our medical system well at all, as the following quote indicates:

What is most striking about this report is how hard the authors searched for data on overuse of health care and how little they found. They reviewed 21 years of the medical literature and evaluated 114,831 publications, yet found only 172 articles that addressed overuse of health care. If we are to improve health care in the United States, we must know as much about overuse of health care as we do about underuse of health care. This article gets us started.

Sadly, there is no international, national or regional correlation between outlays of money, procedures and testing, and longevity or quality of life. [click on the map to enlarge]


Monday, January 23, 2012

Golden Graphics

Today in the Excel Math blog we are going to use one of my favorite subjects - GOLD - to illustrate a couple of math skills that we feel kids should learn in elementary school. Here's a stack of gold bars, just to whet your interest.

I used this same illustration 18 months ago, in another blog on gold. You can check to see how your country's numbers have changed since then - are they saving or spending their gold?


Remember number lines and timelines? We start teaching them as early as Kindergarten.

Here's a quick, 5600-year review of mankind's encounters with gold. The data comes from a website operated by The World Gold Council. [click on the image to enlarge it]


Timelines help us see events in relationship with other things happening at various points in time.

Graphs visually depict changes over time. Here's a chart showing how the price of gold was stable for centuries. The value is displayed by the vertical axis and the years (timeline) are on the horizontal axis.

After many countries linked the value of their currencies to the value of an ounce of gold (1870-1900), gold prices doubled to about $35 an ounce. That price remained stable for another 75 years, until many nations de-coupled themselves from gold. Suddenly around 1980, lots of everyday folks began to buy and hold gold. Some won; others lost in this speculation. The chart below shows the price of gold took 25 years to re-attain its 1980 peak.

Sometimes the data you accumulate can't be displayed graphically like we did above, because the units are unrelated, or the scale is too great. So you construct a table. Here's an example:


I took the number of tonnes (metric tons, or 2204 lbs) of gold held by the top 10 gold-holding countries in the world's reserve banks. I added the country populations, and calculated the ounces of gold per citizen, and the value at today's price. Clearly the Swiss are ahead in wealth, measured by gold reserves.

I hope these graphics make you feel wealthy as well as math-literate!

Saturday, January 21, 2012

An early morning math diary

IN THE EARLY MORNING RAIN ... COMES THE EARLY MORNING MATH

2:41 AM  Playful cat wakes me up. I get up, carry him to the kitchen, and lock him in. Then go back to sleep.

6:31 AM Aircraft begin to fly over our house, starting with CO 1293 at 6:31 AM. I hear the first one, then go back to sleep, while in the meantime, these flights leave (according to SD Airport's website):

DL 4706 6:32 AM 
DL 978 6:33 AM 
UE 5325 6:34 AM 
AA 1592 6:35 AM 
AA 3081 6:35 AM 
US 150 6:37 AM 
US 81 6:39 AM 

I dream about a yellow Corvette Z06 I saw yesterday, driving home from work.


US Flight 3 at 6:44 AM takes off quietly.

6:49 AM Sunrise, although the heavy cloud cover makes it impossible to see, except by passengers on the departing aircraft. I continue to slumber.

AS 493 6:53 AM 
DL 1864 6:55 AM 

7:01 AM I awake and stumble out to the kitchen, free the cat, go out the front door. I walk 80 feet to the sidewalk and pick up my newspaper for Saturday, January 21, 2012. It's number 37,830 since the paper began. If you want to subscribe, you can call 1-800-628-8088 (in the USA).

7:04 AM The thermostat tells me it's 62Āŗ F in the hallway. Brr. I switch on the heater and it starts to warm the house towards the regulated temperature of 68Āŗ F.

7:05 AM I grab the silver MacBook 5,1 (#W891870Z8QR) laptop and begin this diary.

AS 573 7:10 AM 
DL 1592 7:11 AM 
DL 210 7:15 AM 
WN 3942 7:17 AM 
WN 841 7:18 AM 
WN 1050 7:20 AM  etc.

7:21 AM I hear water running. Either someone else is up, or the toilet valve in the back bathroom toilet leaks and it's running by itself.

7:25 AM My wife comes in and says the toilet is leaking. I add a new chore to today's list of things to accomplish.

7:31 AM I look out the window and it's raining outside, or very heavily misting. I check the local weather report from our weather madman a few blocks away - at 7:30 AM, 219 feet above sea level:

Temperature  52.1Āŗ F
Humidity       94.5%
Barometric Pressure 30.05 millibars
Wind speed       0
Light misting rain Rainfall rate 1/10th of an inch
Visibility           1 mile
Clouds overhead 700 feet

7:45 AM  I decide I need some more art in this blog. I grab my camera, ask the cat to pose, and take two photos.

7:46 AM I download the 46 photos that were on my camera, select the last two of the cat, and edit them.

7:50 AM I remember that the rainfall rate was expressed as "less than 1/10th of an inch" and I wonder if he means per hour, per day, per week, or what?  I also see High surf advisory in effect from 5 am Sunday (that's tomorrow).

7:52 AM Have a short discussion with my wife about some news items she's reading in the paper.

7:54 AM Can't decide which to photo of the cat to use so put both of them into this blog. I don't have Adobe Photoshop on this computer, so I fire up Illustrator 10.0.3, and I combine the two photos.


8:00 AM The clock is chiming 8 times as I think about the teachers who taught me elementary math.

8:11 AM I notice the battery level on the laptop is 22% remaining. I'd better hurry.

8:13 AM I finish editing and previewing this blog, and post it.


Friday, January 20, 2012

How Much Dirt, How Fast, How Far, Part III

This week I have been overseeing the fleet of tractors that are moving dirt around on the vacant lots below the Excel Math offices. I've also been investigating the types of elementary math skills that tractor drivers might need.


Here are the pull-push pair, shown coming up on a "road grader" who is not actually in front of them, but on a similar path downhill about 100 feet away.

HOW MUCH WORK?
In the past two blogs I've provided some of the data related to the tractors, and how the contractor can determine how long it will take to move the earth. Where do the charts and raw data come from? From the manufacturer, Caterpillar. They decided how large the tractors could be, how much power was necessary, how much soil could be moved, how fast the tractors can go and how much fuel they burn, etc.

Let's assume
  •  they can move 40,000 lbs (each) for each cycle or 40 yards of soil
  •  a cycle takes 3 minutes
  •  a pair can do 17 cycles per hour
  •  they work 9 hours a day including overtime
That means they can move 80,000 x 17 x 9 = 12,240,000 pounds of earth or 80 x 17 x 9 = 12,240 yards per day!

If we wanted to, we could take the area of the lot (shown yesterday) and calculate the days required to move the soil. But we don't want to do all that work, do we? Besides, I can just watch and calculate from observation. Here's a view from the bottom of the slope as they head back uphill, empty.


HOW MUCH MONEY?
While engineers were designing tractors and measuring their earth-moving capacity, accountants were determining how much money the tractors consume - including original cost, the depreciation, maintenance, spare parts, tires, fuel, insurance and other items. They decide how many average hours a tractor will last - in this case 17,000 hours. Dividing the operating lifetime and the total cost adds up to at least $80-100 per hour per tractor (plus tax and operator salaries). That means the lifetime total spent on each of these monsters is at least $1,360,000.

Using Caterpillar's numbers, the push me-pull you team will cost our contractor about $1500 per day plus cost of the operators.

Would you like to see them in action? I thought so. I walked down and spent a few minutes filming the tag-team operation.


PS: The original pushmi-pullyu from Doctor Doolittle did not move dirt (yes, I read all his books and still have many of them).


Thursday, January 19, 2012

How Much Dirt, How Fast, How Far: Part II

Yesterday I introduced the Push Me, Pull You team of wheeled soil moving machines working down the street from Excel Math. Today we will see what kind of elementary math skills a tractor driver needs to master. Or in this case, a pair of 627F drivers.


I looked through a Caterpillar Handbook and found data that will help the driver calculate how long it will take two 627F machines to move some dirt. We also have to learn beforehand how hard the soil is, how many rocks are there, how much the tractors sink into the dirt, the grade or slope they have to climb, the distance they have to move the dirt before dumping it, and so on.

Then, using the data provided in the handbook, you can determine how long it takes to move dirt. It appears from these charts that our pair of earth movers should take a couple (2-3) minutes per cycle of load-travel-unload-travel. There are lots of numbers here, but it's only elementary arithmetic, not rocket science. [click on the images to enlarge them]


If you can't calculate how much dirt can be moved per cycle, you'll never be able to give a quote to the customer who wants to have his area scraped. You might not have enough days in the schedule, your tractors may run out of fuel, or be unable to safely climb or descend a slope loaded with dirt, or the dirt may be too hard for maximum productivity, or too dusty for the local community to tolerate, etc.

I suspect this gets done well in advance by engineers in the contractor's offices, with only a little input from the drivers. Using the data in the chart and simple math enables us to make an estimate.


In our case, the dirt is fairly soft, yet the contractor has provided a whole fleet! The push-me, pull-you pair, a bulldozer with blade and forks to loosen the soil, a water truck to cut down the dust, a scraper to do precision earth-moving, and a roller to compact the soil once it's been moved. At least 6 pieces of equipment, operators, and fuel, water and maintenance.

Here's their assignment - take the extra soil (about 20 vertical feet, so we need to move 10 feet of depth) from the green area and move it to the red area. Level and compact the soil on the entire lot. Ready? Go!


Wednesday, January 18, 2012

How Much Dirt, How Fast, How Far: Part I

Today's math blog is for men and women who have always dreamed of driving a tractor. A big Caterpillar - a loud, grumbling, earth-moving, wheeled, push-pull tractor scraper. Like one of this pair of Cat 627F monsters:


That's right, they are a pair that work together as a team. Notice in the shot above that the rear tractor is connected so they can push and pull each other. Here's a better angle:


 In the photo below, the back tractor has disconnected and the tow bar is raised.


Now you may be wondering why a tractor driver needs math. Let me show you. Today we will just collect some data. We will list some things to consider when choosing an earth-moving strategy (guided by the Cat manuals). Our 627F models are:

SPECIFICATIONS
  • Length (each) 50 feet
  • Weight 84,000 pounds (empty)
  • Horsepower 330 front and 225 rear
  • Fuel capacity 262 gallons (consumption ~ 40 gph)
  • Top Speed 32 mph
Now, what can they do?

CAPABILITIES
  • Maximum load  48,000 pounds
  • Maximum volume  44 cubic yards
  • Width of cut ~ 10 feet
  • Depth of cut into soil ~ 12 inches per pass
  • Depth of spread soil ~ 21 inches per pass
Here's what our team of scrapers can handle when it comes to the type of soil:

SOIL TYPES
  • Dry  (0-10% moisture)
  • Moist (10-20% moisture)
  • Wet (20-30% moisture)
  • Sand
  • Sand and Gravel (rocks up to 3")
  • Rock (up 50% may be up to 12" diameter)
Larger rocks, harder surfaces, wetter soil, steep banks, very soft sand, etc. all fall outside the preferred conditions for our scrapers. Once we've defined the material we are moving and the grade, we have to worry about getting stuck in the sand or mud. So we consider the condition of the soil:

SOIL CONDITIONS
  • 3% (no tire sinkage into the surface)
  • 5% (up to 2" sinkage into soil)
  • 10% (up to 5" sinkage into soil)
  • 15% (up to 8" sinkage into soil)
  • 20% (up to 12" sinkage into soil)
Finally we need to plan based on the optimal soil delivery distance - how far must it be moved? Very close, and we can just push it with a scraper. Too far, and we need a dump truck. In the middle, we can use our soil movers. Their maximum optimal moving distance is under 2 miles.

Tomorrow we will do some calculations!


Tuesday, January 17, 2012

Why Do I Need To Understand Math?

Kids often share these comments and questions with their teachers and parents:
  • Why do I have to understand math? 
  • I'll never use this! 
  • I have a calculator or spreadsheet so I don't need anything else ... why are you torturing me?
We have several alternative responses
  • Ok fine, you're right, I'll get you out of math class - I never liked math either
  • Hush - do your homework
  • What's the real problem? Have you been unable to grasp this concept?
I prefer to show that math is an integral part of our lives. It's a language that kids need to learn, and neither torture nor an esoteric field of study. Today in the math blog we will look at an example I discovered while reading my newspaper.  Even if you get your news from television or online, you will have seen the same story:

Capsizing of the Costa Concordia

I'm going to work my way through the details of this unfortunate ship running aground, as an example of math adults may need to know. First, the (time/number-filled) map of the incident, then some data from my newspaper:


 Carnival Cruises and the Cruise Industry
  • 2012 estimated industry revenue $30.2 billion
  • Carnival and Royal Caribbean control 74% of the global cruise market
  • Carnival cruises has 101 vessels (now 100 afloat and one on the rocks)
  • Carnival in 2011 had $15.8 billion revenue
  • Carnival in 2011 made $1.9 billion profit (before tax)
  • Carnival in 2011 carried 9.6 million passengers
Distance
  • Costa Concordia was 290m long (951.4 feet)
  • The ship was only 300 meters offshore (one boat length)
Capacity
  • 3800 berths (in one place) and 3800 cabins (in another)
  • 114,500 tonnes (metric tons = 1000 kilos ~ 2240 lbs)
  • 500,000 gallons of fuel onboard, distributed between 17 tanks
  • 17 total decks on the ship, including those not open to passengers

Costs
  • Costa Concordia cost €450 million ($575 million or £375 million or ¥44 billion) to build
  • The "collision deductible" is $40 million
  • At least 5 insurance companies cover the vessel, which is expected to be scrapped
  • The loss is expected to be in the range of $600-800 million
  • The liability coverage carried by Carnival is around $3 billion
  • Passenger "association" class action is already asking for €10,000 compensation per passenger
People
  • 3216 Passengers (maximum capacity is 3780)
  • 1013 crew (maximum capacity is 1068)
Finally, I conclude with another graphic, and a highly-entertaining exchange that I found at an online discussion site. Reader A comments on the graphic, and Reader B comes back with an unnecessarily-sarcastic but highly-amusing jab at Reader A's math illiteracy. This is why you need to study math while in school!


Friday, January 13, 2012

Friday Fun Photography

Photography is a field that's highly dependent on mathematics. Photography is a combination of two Greek words meaning light + drawing (showing with lines) or "drawing with light".

Photography is the art and science of creating durable images by recording light or other radiation using a light-sensitive sensor or film. A lens directs and focuses light onto the sensor during a timed exposure - resulting in an electrical charge for each pixel of the sensor, or a latent image on the film. Later, other technology is used to develop, adjust and display the photograph.

With manually-operated film cameras, it was essential to learn about distances, exposure times, film speeds, depth of field, etc. You had to juggle knobs, adjusting rings and cables. With digital cameras, much of the technical content is different, but you still need to know a lot about light, time, distance, color, etc.

I searched for combinations of the words photography and math, and found dozens of interesting sites. I located (but did not buy)  a book called Mathematics in Elementary Photography, but I couldn't find any books entitled Elementary Mathematics in Photography. I found plenty of lame lessons plans that didn't seem to do much for either photo skills or math knowledge. Here's one site I liked:
I enjoyed the images, an example of which is shown below. The photographer takes the photos first, then she puts lines on them and discovers what functions represent those lines. Or vice versa. It's a chicken and egg kind of exercise.


You have to get into middle school and high school to calculate these functions and plot these curves. We DON'T TEACH THIS in Excel Math elementary school curriculum.

After finding very little of interest on the link between math and photography, I decided that today's blog will have a minimum of math and a maximum of photos. (I'll try to sneak in a tiny bit of math at the end).

Here is a short series of people looking at pictures on walls. My uncle David Freund took, developed and printed the photos and produced this exhibit. I lurked in the background, capturing reactions (and postures) of the viewers, and the contrasts of polished wood against flat white walls and the black and white prints. [click on the images to enlarge them]


Conveniently, most of the viewers were wearing black. Was that a subliminal choice due to the B/W photos, or a reflection of the dismal weather outside?


I did a bit of photography early this morning, warming up for this blog, so I will close with these...


Notice that I spent about a half-hour between the time I took the first shot (above) and the last of 12 shots (below). We DO TEACH calculating elapsed time in Excel Math.


Thursday, January 12, 2012

Geographical Math, Part V

This is the 5th installment on numbers describing US geography. I chose geography because it promised to contain lots of numbers (see yesterday's post), giving me a chance to showcase how we use elementary math. 

Talking about territories and states and counties leads to the ultimate political subdivision - the citizen. As I was counting and sorting people who live in the US, I wondered, "Are there classes of citizenship for each kind of political subdivision?" Let's find out - and we'll throw in some numbers if possible.

CITIZENSHIP
In the United States, citizenship most often acquired in one of two ways - you are either a "natural" citizen or a "naturalized" citizen.
  1. Citizens from birth are "natural" citizens.
  2. Those acquiring citizenship after birth are "naturalized" citizens. They can take a class, pass a test and be sworn in as citizens (the most familiar way) or can be adopted en masse ( Congress granted citizenship to all Puerto Ricans in 1917, and all Native Americans citizenship in 1924).
If you were not born on US soil but were adopted, born of a surrogate mother, born "out of wedlock", conceived via artificial insemination, or have dual nationality, then you may face extra hurdles becoming a naturalized citizen.


Natural citizens can be divided into two groups; those having been born themselves in the US, or under its jurisdiction, and those that acquired their citizenship by been born to parents who are citizens of the US.

Here are some legal (Latin) terms that describe categories of citizenship:
  1. People born on U.S. soil or its jurisdictions are citizens under the doctrine of "jus soli" or by "right of the land". 
  2. People born of parents who were citizens (but not on US soil), are citizens under the "jus sanguinis" doctrine or "right through blood". 
  3. A third phrase describes a way by which people who have married US citizens may be naturalized: the "jure matrimony" doctrine, or "right through marriage".
NOTE: These technicalities make a difference when you are traveling abroad. My former boss and his wife were asked to leave Canada after living there on a work permit for 5 years - due to Canadian re-interpretations of her citizenship, because she was born in a US embassy in Africa rather than on US soil!

You can expedite US citizenship by serving in the US military. In the past 10 years, 76,000 people have became naturalized citizens by serving in these 26 countries: Afghanistan, Bahrain, China, Hong Kong, Cuba (Guantanamo), Djibouti, El Salvador, Germany, Greece, Haiti, Honduras, Iceland, Iraq, Italy, Japan, Kenya, Kosovo, Kuwait, Kyrgyzstan, Mexico, Philippines, Qatar, South Korea, Spain, Thailand and the UK.

MULTIPLE CITIZENSHIP
In some cases people may end up with dual (or multiple) citizenships, because it is the country who defines (claims) who its citizens are. More than one country can define or claim you as its citizen.

NO CITIZENSHIP
If a country ceases to exist, or is in the midst of war or ethnic conflict, or rejects its citizens, many people may suddenly become stateless - with no citizenship in any country. The nomadic Romani people (gypsies), are denied citizenship in many countries. A child born outside either parents' home country, or a child with no birth certificate, may be stateless and end up in a refugee camp, like the "Lost Boys of Sudan". About 12 million people worldwide were stateless in 2011.

LOSS OF CITIZENSHIP
A few actions can cause you to lose citizenship, or you can choose to renounce US citizenship. Although we often hear about people coming to the US, we seldom hear about the citizens who renounce their citizenship. This US State Department page outlines the various categories for losing or renouncing citizenship.

US CITIZENSHIP STATISTICS

The Census Bureau uses the term native to refer to anyone born on US soil, or born abroad with a US citizen parent. In 2010, including the military and others living abroad, the Census Bureau said we have approximately:

267 million native (natural citizens)
  16 million foreign born (naturalized citizens)
  21 million foreign born (not citizens)

NOTE: The Census Bureau uses the term foreign born for naturalized US citizens, people who are undocumented, lawful permanent residents (immigrants), temporary visitors (tourists, foreign students, farm workers), and humanitarian immigrants (refugees seeking asylum).

Wednesday, January 11, 2012

Geographical Math, Part IV

Greetings! I am jumping back into a topic that we started last week. This blog is about using elementary (but not easy!) math, as taught in our Excel Math curriculum.

People often think of the United States as being composed of 50 states. Period. Full Stop. No more. But amazingly, there are far more governmental subdivisions than we expect. And it turns out that counting them is like herding cats. To establish order on these cats, I decided to build a table as I help kids learn to do in math class.

 Division Inside US Number Continent IslandOn USA soil?
 State Yes 50 Yes  Yes  Yes
 District Yes 1 Yes No Yes
 Commonwealth No 2 No Yes Yes
 Territories No 20; + ships No Yes Sort of; international
 Jurisdiction Diplomatic No  200 + Yes Yes Yes, inside foreign country
 Jurisdiction Military No  ~ 1100 Yes Yes No, inside foreign country
 County/Parish/Borough Yes ~ 3140 Yes Yes Yes
 City/Town Yes ~ 30,000 Yes Yes Yes
 Reservation, Home Lands Yes ~ 300 Yes Yes Sovereign nation inside US
 Foreign Embassies (see list) Yes ~ 150 Yes YesNo; diplomatic immunity

If you recall, in prior blogs I addressed most of these entities, except Reservations, Rancherias and related entities in Alaska and Hawaii. These subdivisions are unique in that they are considered "domestic dependent nations". They are within the US boundaries (domestic), have a relationship with us for defense, etc (dependent) but have self-determination or rule (nation). [click on map to enlarge it]


The US Consitution says “Congress shall have the power to regulate Commerce with foreign nations and among the several states, and with the Indian tribes” so even though reservations fall within state boundaries, tribal sovereignty is dependent on, and subordinate to, only the federal government, not states. Other judgements have clarified things: “the establishment of a reservation by treaty, statute or agreement includes an implied right to hunt and fish on that reservation free of regulation by the state.”

Chief Justice Thurgood Marshall stated “England had treated the tribes as sovereign, and negotiated treaties of alliance with them. The United States followed suit, thus continuing the practice of recognizing tribal sovereignty. When the United States assumed the role of protector of the tribes, it neither denied nor destroyed their sovereignty.”

I'm not an expert on Indian affairs but we do have more reservations in San Diego County than any other county in the United States. Here's a new chapel designed by a friend of ours, Kevin deFreitas, located on the Reservation of the Rincon Band of the LuiseƱo Indians, a few miles north from the Excel Math offices.


Tuesday, January 10, 2012

Evidence-Based Education, Part II

Welcome!

Yesterday in the Excel Math blog I complained about the complexity of evidence-based decision-making. I said the process is too complicated. Its very complexity and complication drives out simple but valid options. I normally talk about using elementary math in everyday life, but any curriculum selection decision-making process transcends simple math. [click image to enlarge]

 Paraphrasing  Benjamin Graham very slightly:

Normally, mathematics is expected to produce precise and dependable results; but in the stock market, the more elaborate and abstruse the math, the more uncertain and speculative are the conclusions.

In 44 years of Wall Street experience, I have never seen calculations made about stock values or investment strategies that needed to go beyond simple arithmetic or elementary algebra. 

Whenever calculus is brought in, or higher algebra, take it as a warning that the speaker is about to substitute theory for experience, and make speculation seem to be investment!

Keep this quote in mind, and substitute procurement for investment as appropriate!

Acquisition and Procurement
With a few clicks of the mouse you can investigate dozens of purchasing projects that end up being scrapped due to complexity. [ Notorious examples include US Air Force tanker aircraft contracts and the UK's NHS computer system, etc. ] I have participated in several smaller but (in)famous development projects myself.


In the Education business, we as a society (superintendent, school board, principal) appear to be going down the same path. We decide that those closest to the action (teachers, parents) can't make decisions on their own.

The process, by its very complexity, demands that decisions be made by professional evidence-sifters - pushed upwards to a higher authority, who makes a judgement affecting more than one school or district - perhaps even a whole state.

One advantage from a School District point of view is the implied credibility of this decision-making process:
  • Who would criticize decisions made on the basis of facts? (Can you go wrong buying IBM?)
  • Are you setting yourself up against our authority? 
  • After all this, why would you debate our decision? 
However, it is simplistic to think that decision-making is funded, pursued and concluded in a completely objective way. Even if we do set our biases aside, refrain from emotional influences and spurn illicit offers of personal enrichment, the "evidence-based" process implies
  • We eliminate smaller companies, resource-poor researchers, non-expert witnesses, or advocates from either extreme end of the spectrum
  • Few decision-makers will re-study something that has been panned before
  • Only the most popular products are worthy of study
  • Only the most readable papers get published
  • Only the most attractive ideas get funding
And we layer this evidence-based evaluation onto an already laborious adoption process (6 years in California)! If it takes longer to choose the curriculum than a student stays in a public elementary school, are we over-thinking it?
I'll close with an illustration from an earlier blog on objective measures for the subjective topic of pain. Please select the level of pain you associate with involvement in a procurement project: