Additional Math Pages & Resources

Thursday, March 31, 2011

Don't Count On It

This blog is more or less focused on ways that we as grown-ups can use the elementary math we learned as a kids.

Today the subject is the phrase Don't Count On It. A related phrase is Don't Count Your Chickens Until They Hatch.

What do we mean by these words? Are these math-related phrases, discussing the process of Addition? Or not? What are we trying to communicate?

I checked a variety of sources. Here's what they said:
  • Do not assume it is going to happen
  • Don't depend on it
  • Don't depend on someone or something, especially in a difficult situation
  • Wait until you see it before you believe it
  • Wait for the evidence rather than jumping to a conclusion
  • One of the 20 possible phrases given by a Mattel Magic 8 Ball
  • A book by John Bogle, founder of the Vanguard Group (Read an excerpt)
  • An article on the Latin American Piraha tribe who don't have numbers in their language
  • Equivalent to "Let's just be friends" when said by the other person in a wanna-be romantic relationship
  • Fat chance
  • Keep on dreaming
  • Don't hold your breath
  • Not likely!
  • Cha skrunee da pat (the Huttese phrase as spoken by Jabba the Hutt, in Star Wars)
  • A line from Please Tell Me Why by the Dave Clark Five 
  • And finally, it's a puzzle that holds money but doesn't let you get to it.

This is the most enlightening definition I found, on a site aimed at people using English as a Second Language:
  • Don't Count On It is almost a definite no, with a very slight chance things could be different. That chance is so small, that you would be better off saying probably not. When you say I wouldn't count on it it's another way to say you're betting the odds are 99% on no.
The phrase apparently means "No" without coming right out and saying it. Or in math terms, we could say it's Approximately Equal To No.

Friday, March 25, 2011

Four Hundred

Yesterday was my 400th posting in this series of articles about how we adults can use math we learned in elementary school. You could read one of my previous posts about the calories required to heat 400 ml of water, or go here to for more on the number 400 and its ramifications.

Today I have decided to explore how we use the number 400 to adjust our Gregorian calendar.

We divide 400 into the calendar year date at the beginning of a century, to see if that year will be a leap year or not. You don't follow me? Let me explain a little bit further.

If the solar year was exactly 365 days, we wouldn't need leap years. But it isn't 365 days. It's longer.

A year is almost 365.25 days (365 days + 6 hours) long, so every 4 years we add one day to our calendar. This resolves the issue of the year being 1/4 day (6 hours) longer than 365 days.

Sadly, a year is not quite 365.25 days either. It's a bit less. About 11 minutes less. So we make another adjustment.

Years evenly divisible by 100 are not considered leap years, unless they are also evenly divisible by 400. The years 1600 and 2000 were leap years, but 1700, 1800 and 1900 were not leap years, nor will 2100 be a leap year. This extra-fine adjustment process resolves the issue of the year being 11 minutes shorter than 365 days, 6 hours.

The average number of days per year by this formula is

365 + 1/4 day − 1/100 day + 1/400 day = 365.2425 days.

Did you get that?

365.0000 + .2500 - .0100 + .0025 = 365.2425

You might ask, How can we turn this decimal number (.2425) into our familiar time units of hours, minutes and seconds?

.2425 days = X hours, Y minutes and Z seconds

Let's get the number of seconds in a day (24 x 60 x 60 = 86,400)

.2425 x 86400 = 20952. Our year is 365 days and 20952 seconds.

Now you are likely to say, But I want hours and minutes and seconds!

I have to warn you that the following process is relatively easy to follow if you do it longhand, but confusing when you use a calculator - because we want integer remainders in second, NOT decimal remainders of various time periods. Here's what I mean:


Divide 20952 by 3600 (seconds in an hour) to learn the number of hours

20952 ÷ 3600 = 5 hours with a remainder of 2952 seconds

Divide 2952 by 60 (seconds in a minute) to learn the number of minutes

2952 ÷ 60 = 49 minutes with a remainder of 12 seconds

Thus the year (as adjusted by the Gregorian calendar) is 365 days, 5 hours, 49 minutes, and 12 seconds long.

I did a bit of research and the most accurate measurements of the movement of the earth say the year 2000 was 365 days, 5 hours, 48 minutes, 45.19 seconds (and slowing). You might ask me,
 
What will we have to do to adjust for this 26.81 second discrepancy between actual and theoretical calendar years?

I'll reply, I've given you the pattern, so you can figure it out.

I'm taking a couple days off to go on a short vacation.

Thursday, March 24, 2011

Square Footed, Part III

In the past 2 days we have used elementary math skills to calculate the footprint and hat size of a house. Now we are going to learn how much attic space needs to be ventilated (we could say the house's cranial capacity).

Many houses have ventilated attics - outside air circulates freely above the ceiling and below the roof. This reduces build-up of heat and moisture that might damage the house. When you live in moderate coastal or desert areas like San Diego, venting the house is very important.

Here you can see a couple of the attic vents at my house. On this side of the house, we  ventilate the part of the roof that overhangs the exterior walls. I think we have 12 soffit vents to let cool air in, and several large gable vents that let hot air out.


A general building code rule-of-thumb is to use 1 square foot of vent for every 300 square feet of attic space. Let's take a look at our sample house again.

Here the roof outline is shown in light brown. It's roughly 36 squares, or 3600 square feet. If the room represented the attic space, we would need 3600 ÷ 300 = 12 square feet of attic ventilation area (screened vents along the edges and gables, or in the top of the roof itself).


Here is a more detailed look at the house with the rooms shown. The brown areas are porches, and don't have any attic space above them. The garage is open all the way to the roof. The bedroom, living room and entry have cathedral ceilings, and we don't need to ventilate anything that hangs out over the exterior walls of this house.


Using the dimensions on the first drawing, we can calculate that the bedroom is 280 square feet, living 330, porches 500, garage 400, entry 300 and overhang 300. Adding those gives us about 2100 square feet. Subtract that from the total of 3600 and we have a remainder of roughly 1500 square feet of attic space. Divide by 300 to discover we need only 5 square feet of ventilation area. That's less than half of what we assumed before when we used the roof dimensions.

NOTE: Remember that I'm not a contractor or builder, but a creator of problems for elementary math curriculum. Please don't build your house based on the sample drawings or the problems in this blog!

Square Footed, Part II

This blog is about how grown-ups use math they learned as kids. Hopefully you learned with our Excel Math curriculum.

Yesterday we talked about square footage of a house, calculated from its floor plan. We calculated the size of a house's footprint. Today we look at another way to indicate the size of a house. This could be called its hat size.

The area of a roof is usually larger than the square footage of the floor plan under the roof.  The roof protects the house from falling rain and snow, so it should be larger than the area it is protecting. How much larger? It depends. The local weather, neighborhood styles and the architects determine the roof design.

A multi-story house might have a smaller roof area than floor area because there can be several floors whose areas are added together.

Here is our sample house from yesterday, covered with a roof of my choosing. First, a transparent version to show that all rooms are covered. From this drawing you cannot see the slope of the roof (how high the peaks are), but I put in a few gables (sub-roofs) for variety.


I also made a more detailed drawing below, to show how I might calculate the roof's area (there are other ways you could do it):

NOTE: The dimensions will have to come from the architect and not from this drawing, because it does not portray a flat surface like a floor.
  1. Find the yellow roof area R by multiplying the length and width of RA and RB and adding them together. 
  2. Calculate the area of Chimney X and subtract it from R.
  3. Now find the area of the gables. Multiply L x W for each section of the roof. For the area of a right triangle (AE and AF), the formula is (L x W) ÷ 2. The triangular regions are shown in green.
  4. Gable A's area is the sum of the areas of AA + AB + AC + AD + AE + AF. Use the same process for the other gables.
  5. Now subtract from R the area covered by gables above R. We only need to know the areas covered by the green and blue sections.  (I calculate the purple areas separately because they add to R and do not overlap it.)
  6. We won't do the exact overlap calculations here because it's a complex job to accurately calculate the slices of a sloping roof section.
  7. So the complete process is: Get roof area R, learn area of gables A, B and C and add these all together. Subtract the overlapped areas of R shown in blue and green.


The result is the hat size, or area of the roof in square units. Now that we have done all this work, it's time for me to tell you that roofers in many English-speaking countries use their own unit of roofing measure, called a square (100 square feet of material). They use special terms too, such as hips, valleys, peaks, ridges, eaves and rakes and pitch.

My 2200 square foot house needed 30 squares of material. That's about 3000 sq ft of roof.


Here are a couple sites that can help you measure your own roof, or you could special calculator device, or a roofing calculator app for your phone.

ROOF HELP

ROOFING CALCULATOR

Wednesday, March 23, 2011

Square Footed, Part I

Welcome to the Excel Math blog, where we remind adults how to use math they learned in elementary school (and show kids that it's not a waste of time).

Three days ago we reviewed how to determine surface area or square units. Then we talked about the units of measure used while searching for a house - bedrooms, size in square feet, neighborhood, etc. Today I want to look at square footage.

My first house was very simple. Located on the back of a 2-house lot, it was a converted garage built in the 1930's. It fell down shortly after we moved out. (Pardon all the space around the house, but this lets me keep all the drawings on this page at the same scale.)


We had mostly rectangular rooms, with one closet, one bathroom, a kitchen/dining area, a small living room and two small bedrooms. Altogether, it was about 450 square feet. Since the walls were thin and there were no hallways and only one closet, virtually all the space was usable living space.

Here's a modern 3-bedroom, 2-bathroom house, on one floor. I picked this plan randomly off the Internet; the source claimed it was about 2400 sq. ft. Using all the dimensions shown on the plan (except garage), I get 1937 square feet, to which we have to add the hallways.


Because this is a complex layout with odd shapes, angled corners, and lots of "public" space, we will have a tough time verifying all the measurements. Let's assume they are accurate.

Here's another look at the parts of the house, grouped together by function. Would this presentation help you when you go out looking for a home to rent or buy? Would you like to see the square footage for each function to see what was most important to the designer?


We'll have more on this tomorrow.

Tuesday, March 22, 2011

A Landlocked Enclave

Today we will look at the mathematics of land-locked-ness (not to be confused with Scot-land's Loch Ness, shown below).


I covered some elements of this topic in a post last year.

Most countries have borders that separate them from adjoining nations, as well as direct access to navigable deep water (seas, oceans, large rivers, lakes and canals). That allows them to import/export goods just by crossing their own borders.

Land-locked nations are those countries that have to go across the land mass of an adjoining country in order to get to the water. According to Wikipedia, there are currently 47 landlocked countries. Other sources show 44 countries. Some nations are landlocked during certain parts of the year, when their ports are closed by ice or inclement weather.

(You might call an island nation water-locked, as it is completely surrounded by water.)

Two countries are double-land-locked - Lichtenstein and Uzbekistan. They have to cross two borders to get to an ocean.

Three countries are completely landlocked by one single country – that is they are situated within and surrounded on all sides by just one country. These countries are called enclaves:
  • the republic of San Marino (Italy)
  • Vatican City (within the city of Rome, Italy)
  • the Kingdom of Lesotho (South Africa)
The last of these, the Kingdom of Lesotho, has a population of about 2,000,000 people. One of them visited our math blog this week. Welcome! 

NOTE: Lesotho is not that far from Reunion Island, east of Madagascar. Someone from Reunion visited us last week.

Here are a few math facts and figures about Lesotho:
  • the lowest elevation is 4593 feet above sea level, making it the highest country
  • the economy is based on revenue from diamonds, fresh water, and clothing 
  • literacy is very high - estimated at about 85%
  • sadly HIV/AIDS affects many citizens, and life expectancy is only about 40 years
This topographical map shows the mountainous terrain of Lesotho, and its distance to the port town of Durban, South Africa.


Due to the shared needs of landlocked nations, there is a special United Nations group to represent them. It's known as The Office of the High Representative for the Least Developed Countries, Landlocked Developing Countries and the Small Island Developing States.

Monday, March 21, 2011

The Best Unit of Measure

Apples or oranges are sold by weight. Artichokes and ears of corn are sold by the piece. Milk by the gallon. Bread by the loaf. Which unit of measure do you use to buy things? How do you decide?

How about houses? Do you shop primarily by bedrooms, bathrooms, square footage, location, price, age of neighborhood or quality of schools? 

I did some research on three areas near the Excel Math offices. Some of the data I found is shown in the table below. I was surprised to see houses with NO bedrooms, but I think they represent houses that have been turned into small commercial buildings or offices.
You can see the differences in the neighborhoods by looking at the numbers - you don't need pictures to see if you want to (or can afford to) live in a neighborhood.  And in case you were wondering, no, I don't live in any of these.

Statistical nuts can slice and data this data in many ways - one popular comparison number is cost per square foot. I found some average sales in the past year for single-family homes in the three areas:

$124 per square foot in Mecula
$214 per square foot in Mesa
$462 per square foot in Palo

Ouch! Even though they have fallen dramatically, it's clear that home prices in California are high.

To give you a shocking comparison, a developer I know sold a 4400 square-foot, 4-bedroom condominium in this same region for $1705 per square foot.


We often need to choose the right numbers to compare when we are trying to make a complex purchase - and even elementary school math can help.

However, no math I can think of will convince me I could afford this place!

Friday, March 18, 2011

Area You With Me?

Often kids learn math concepts at different times and in different ways. In schools we tend to want everyone to learn together in a similar way - it's easier to present material that way. But what happens if your child doesn't learn a particular concept when the class schedule calls for its presentation? In some cases, that's just too bad. He or she won't get another opportunity that year.

Excel Math uses intensive spiraling, which means we present most subjects multiple times, and we review or refresh those concepts throughout the rest of the year. Does this bore kids who learned it the first time? Occasionally yes. Often not.

Enough of math theory. Let's get to the practice. What are the surface areas of the following red shapes?


Is your reaction How am I supposed to know? or did you immediately get a ruler, put it up to the screen and start measuring and recording dimensions?

Does this presentation help you? Are colors better than plain red? If so, why?


Let's go a bit further. If I make the colors transparent and lay them over a grid? Does this make it easier yet? Do the grid lines save you time and energy, or do you ignore the colors and count squares (while thinking these colors are so distracting)?


Did you learn the colors and use them to save time once you've solved one or two area problems? Was I consistent in coloring blocks of different value?
Shall I leave out the colors and just leave you to the counting? Save you all the distraction of labeling the colors, deciding how many squares each one represents, etc?

OK, here are the grid lines by themselves. Go to it, linear thinkers.


Finally, here are the grids and my counts, along with one possible process for arriving at the area solutions. 

Why do I say one possible process?

Because the way I visualize and count the squares is probably not the way you do it. I tend to put my finger or thumb up to the screen and block off groups of squares to aid in my counting. You might count across in rows, while another person counts down in columns. When I added the colors you could see a bit of my thinking in the way I did the color groups.

The methods any given person might use can be very hard to predict - but the answers should still be the same. This simple example shows how Excel Math uses different approaches to presenting problems, so kids can find a process that resonates with them.

Thursday, March 17, 2011

My Name is Gas, Natural Gas - Part III

Today we will continue this series on Natural Gas by taking a look at Metered Service.

Most of us are familiar with the Meter Reader, a person who walks along in the neighborhood, avoiding angry dogs while using a notepad, scanner, or other tool to record the gas and electric meter readings. This usually happens once every month or two. A few days later, we receive a bill in the mail for our energy usage.

Here's a graphical look at the once-a-month data collection points: [click any chart to enlarge it]


The month of March is shown by the green line (St. Patrick's Day). In this case, I show the meter reading at 8 am on the 1st of the month, but it could be any time of the day when the reader comes. Our guy usually shows up on the 17th each month in the afternoon. It doesn't really matter if they measure once in 30 days or 31 or 32 days as long as the bill is accurate.

This meter-reading-person tradition is ending in many locations, as the utility companies switch to remotely-read digital meters. I got new meters last fall, on both the electric and gas service.

With the new electronic meters, the utility company has the option of billing us with different charges for our consumption at different times of day. This way they can charge more in the daytime, when usage is highest, and less at night when there is a surplus of gas (or electricity).

I'm going to make an assumption that the peak times are from 8am-5pm, the off-peak is from 5pm-6am, and the semi-peak is from 6am-8am when we all get up and get ready for work. Weekends and holidays are billed at the off-peak rate.


Can you see the math implications for the local utility companies? They have to collect lots of data each month, multiply it by the proper rate for the time of day, the part of the city you live in, the season of the year, the baseline or non-baseline rate (which is measured by usage per month!) and so on. How much more work is this billing effort? What are the chances for error?

Here's what I estimate. They used to have:
  • 1 billing period per month, or 12 billing periods in a year 
  • multiplied by baseline and/or non-baseline rates
  • 12 x 2 = 24 calculations per customer x 4 million customers = 96 million calculations
they now have about:
  • 77 periods in a month, 924 in a year (+/- depending on holidays)
  • multiplied by peak, semi-peak, and off-peak and baseline and/or non-baseline rates
  • 924 x 3 x 2 = 5,544 calculations per customer x 4 million customers = 22.2 billion calculations
Here's how I prepared my estimate:


One additional complication - they don't want any minutes unaccounted-for, and we don't want to be double-billed for any minutes, so they have to decide if the period ends at 07:59:59 and the next one starts at 08:00:00.

More questions:
  • What about lag times when an account is started or turned off? 
  • What if the clocks or the electricity go off? 
  • What happens if the meter transmission doesn't reach headquarters?
  • What do they do with the bonus (minus) hour on Daylight Savings Time?
  • On which day of the month do they do the cut-off from one bill to the next?
  • Do all customers get billed on the same day, or not?
  • If not, on what schedule do customers get billed? 
  • The old one based on meter readers?
All simple elementary school math. No rocket science here. But lots of decisions.

The big questions are - IF we put in these expensive meters, and IF we lay off the meter readers, and IF the customers reduce their usage enough so that we don't have to add capacity or buy more natural gas next year, THEN will we actually reduce our revenue to the point where we will not be able to pay for the changeover?

If so, can we then raise the rates to make up for those costs DESPITE the fact that customer use of our product is declining? Or are we better off doing nothing?

In California, forecasts predict our overall consumption of natural gas WILL NOT change in the next 20 years, even if prices go up or down, and population goes up or down.

Wednesday, March 16, 2011

My name is Gas, Natural Gas - Part II

This blog is aimed at adults. We demonstrate how to use basic math you learned in elementary school, and how kids can use what they learn today.

Our Excel Math curriculum also reflects real-world usage. We don't create problems in imaginary worlds (Bikini Bottom where SpongeBob Squarepants lives, or Lazy Town where Spartacus saves the day, or the Big Oak Tree where Mr. Squirrel keeps his acorns).

Real life is more interesting, harder to predict, and full of fascinating math opportunities. Yesterday I learned that my local natural gas utility creates an energy factor that reflects the heat content of gas used in 6 zones around the county. They adjust our bills accordingly.

Here's a GAS SERVICE table showing recent natural gas costs. The column headings are:
  • Baseline = a reasonable amount for an average household (available at a low price)
  • Non-Baseline = any usage over baseline (Swimming Pool Heater, long showers, etc.); charged at a higher cost
  • GTC means Gas Transportation Cost which reflects getting the gas to us 
  • GPC means Gas Procurement Cost which is what they pay for the gas
  • Total cost is the combination of cost plus shipping (pipeline, etc)
 

Once the procurement and transportation are taken care of, the energy content is measured and adjusted by the therm multiplier, as shown in the GAS ENERGY CHARGE table below:


When these things are combined, you get a natural gas bill. Here's a sample:


The amount we pay is a total of the Gas Service and the Gas Energy Charge. This particular bill is more complex than usual because the Gas Energy Charge changed in the middle of the month.

This is not too difficult for elementary math, even if it looks daunting at first glance. If you think this is complicated, take a look at your electricity bill!

Tuesday, March 15, 2011

My name is Gas, Natural Gas - Part I

This post is not about food, or intestinal distress. Nor is it about gasoline (petrol).

It's about gas - a colorless, odorless fuel that we burn for cooking, heating, lighting, fireplaces, etc. There are many forms and names for gaseous fuels today - including natural gas, Compressed Natural Gas (CNG), Liquefied Natural Gas (LNG), propane, etc.

The names methane, propane, butane, etc. describe varieties of hydro-carbon fuel gases. Natural gas as we know it in the United States is mostly methane and comes out of the ground like oil.

Gas can arrive in containers or be delivered by a truck, but most gas arrives through a pipe. Here's an image from a gas utility company, showing how it comes to us:


The gas company has compressors that push the gas through underground pipes to your house, through the meter and into the stove or heater.

Today I want to look at the units of measure for gas and see how they fit in with the elementary math on which we non-mathematicians depend. It's a troublesome substance to measure, due to the "temperature/pressure relationship".

Gas is metered out to us in various ways:
VOLUME 
  • the cubic foot
  • a therm (100 cubic feet)
  • the mcf (1000 cubic feet)
WEIGHT
  • pounds or kilograms (as with propane for your gas BBQ)
 ENERGY CONTENT
  • British Thermal Unit [BTU] or the energy needed to raise 1 pound of water 1 degree F. A quantity of 1000 BTUs ~ roughly 1 cubic foot
  • Gasoline Gallon Equivalent [GGE] or the energy equal to that in a gallon of  gasoline

Let's summarize -  1.15 therms  (volume)  ~ 5.66 pounds (weight) ~ 115,000 BTUs  (energy) ~ a gallon of gasoline

Confused? Do you wonder, Why all these different units of measure?

Natural gas is compressible. If you heat it, gas expands; if you cool it, gas contracts. At which point on a hot day is it most profitable to buy or sell? We had to set up rules. In order to sell it by volume, you need to specify the temperature and pressure at which you measure.

If you sell by weight, the same thing applies. You need to know the pressure to know how much gas is in the pipeline, or the container.

Since we almost always use gas for fuel, it seems useful to sell it by the energy contained in the gas. If we used it for filling up balloon or inflatable swimming pools, energy content wouldn't be a good standard of measure.

Does the energy content in natural gas vary? Yes. Our local utility says:

Natural gas is composed of methane, ethane, propane, butane, and nitrogen. Each gas has a different heating value, and their proportions in natural gas vary. The same volume of natural gas from two sources may have different heating values. We bill customers for the amount of energy contained within the gas. Natural gas is metered by volume (units of 100 cubic feet). We then apply a factor to reflect the heating value of the gas. Our Service Territory has been divided into six Thermal Zones. The heat content is measured by gas heating value measurement stations in each zone. The stations monitor the gas continuously; heat value is averaged in each area for each billing month.


Sheesh. That's enough complexity for today. I shouldn't have done this blog right after lunch. Now I DO have gas ...

Monday, March 14, 2011

Time and Time Again

We had to reset our clocks yesterday for Daylight Savings Time. As always, people showed up late to church, having forgotten to "Spring Ahead".

Resetting the time is not a big deal if you have a wind-up wrist-watch. We teach kids how to read a clock in elementary math class - although now that I think of it we don't teach them to SET a clock or watch.

It's normally no problem at all if you use the clock in your mobile phone. Someone else in telephone land has to make the decision to jump forward an hour at 2 am on Sunday morning. If they remember, you are fine, and if they forget, you can't do anything about it.

It's more of a problem in a car. I have several cars and I can't remember how to set the clocks in each. In fact, in two of our cars I have both a clock in the radio and a clock on the dashboard. They are set in different ways, but we still like them to both be on the same time.


The Honda's clock resets like this: The word Clock appears in tiny letters above the 6 button (I have made them yellow for visibility). Tiny H, M, and R letters are below the 4, 5 and 6 buttons. Hold down the button above Clock and then press the 4 and 5 buttons to change the hours and minutes. I don't know what the Reset button does.


The Volvo's clock resets like this: Turn the highlighted knob left and right to set the clock forward or back. Easy, once you remember how to do it!

These are relatively simple. Things get slightly more difficult as we go into the kitchen and have to reset clocks on the stove, microwave and coffee-maker. Here's the stove:

Press and hold the minus (-) button. After 4-5 secs the clock will reset itself allowing you to adjust the time. First select the 12/24 hr setting using the +/- button, then press the 'step' button, then adjust the time itself using the +/- button. When the correct time is displayed press the 'step' button again.  Easy!

Finally I made it back to the bedroom and the watch cabinet.


 I started with the Breitling Aerospace. Thanks to the Internet ... I got it reset.

I don't care if all our watches are set today. When I need them, I will wind and set them. I have already used up the entire hour I gained this morning!

Friday, March 11, 2011

The Math of Farewells

Ending days at any job are often (always?) traumatic, even if you're leaving of your own free will to "pursue other interests". Today we have a sad departure - one of our folks is leaving us and ending employment at The Mighty Ansmar Publishers, home of Excel Math.

I'm going to make this departure a math problem, to give you an example of the sorts of things that kids learn using our elementary math curriculum.

Here are the rules.

1. I will provide the number of calendar days that have elapsed since the 10 people on the list below STARTED working at Ansmar. I call this the Job Duration Number (JDN).

2. Once you have seen the number of days, I will give you a math problem to solve, which will reveal the person who is leaving.

3. It's up to you to determine who will be a former employee at 4:30 this afternoon,

4. And who is the newly-hired replacement.

Ready?

Go!

JDN  NAME
6280 Brad
6070 Dave
5410 Becky
5125 Bob
4700 Jim
2660 Mike
2000 Carmen
0950 Nick
0920 Darcie
0005 Lavonne

Whose job duration number consists of an odd number of hundreds with zero tens and zero ones? _______

Take that number and subtract 100. _______

Take the resulting total and use it as the dividend in a division problem. Use as your divisor the  job duration number of our most-recently hired employee. The quotient is the number of the person leaving today.


Who is leaving?  ___________


and who is the most-recently hired person? ____________

Thursday, March 10, 2011

Welcome to Reunion math, Part II

This is the second post about Reunion Island and how an elementary school mathematics education (as taught in our Excel Math curriculum) helps us understand what happens there. If you missed yesterday's blog, a visitor from Reunion dropped in at this site on March 3rd, 2011.

Reunion is famous for its rainfall. How much rain? you might ask. A lot! I reply. A mind-boggling amount of rain falls in the mountainous slopes of Reunion.

NOTE: in elementary math class, we teach kids to create tables like this, and how to select columns,  rows, headings, units and so on to best display the data. Here I have chosen time periods, days, inches and years. The years are provided in order to emphasize that this rainfall business is not a one-time fluke!

Here are some rainfall world records held by Reunion Island:

Period Days Inches Year
12 hour
1/2
45
1966
24 hours
1
71.8
1966
48 hours
2
97.1
1958
72 hours
3
154.7
2007
96 hours
4
191.7
2007
240 hours
10
223.5
1980
720 hours
30
257.1
1993
8760 hours
365
708.7
1993

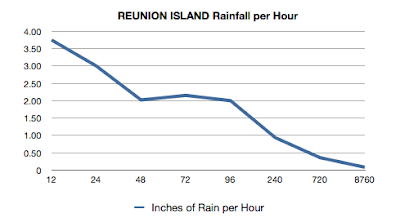
Now just for fun, let's see if we can plot these values on a graph. We derive some data points by dividing record rainfall (column C) by the hours (column A). We can now show Inches of Rainfall per Hour.

Whoops. That's not very impressive, is it? The chart is going the wrong direction - it doesn't really scare us. Let's see if I can come up with another presentation that highlights the magnitude of the rainfall.

NOTE: in math class, we teach kids how to create a variety of charts and graphs, and how to select the right chart to best display the data. Although a spreadsheet tool can "create" a graph for you, YOU need to decide what data you want to emphasize.

While I think about this, take a break for a very nice illustrated photo journal of Reunion.

======================================================================

OK, we are back and I have come up with a new way to present the annual rainfall records:
  •  the blue area represents record rainfall, from the data table above
  •  the yellow area is the average rainfall on Reunion (not shown in the table)
  •  the red area at bottom right is average rainfall in San Diego where Excel Math is located
 [Click the chart for a larger version]
At bottom left is a touring motorcyclist with passenger drawn to the correct scale to match the rainfall!

What can we learn from this?  On Reunion Island you'd better check the weather before leaving the house.

Wednesday, March 9, 2011

Welcome to Reunion math, Part I

Many of us have been to college or high school reunions. A reunion is an social event where people get together, remember the old days, and marvel at how other people have aged ...

Reunions require basic math, because your mind will automatically think "Has it really been 40 years since I graduated from high school?!"

Today, instead of going to a reunion, we are going to recognize a reunion that has come to us. On March 3, 2011, my Flag Counter tells me a visitor from Reunion Island (La Réunion in French) came by the blog. Strictly speaking, Reunion is not a country of its own, but a department (region) of France. But we'll take the visit gratefully anyway. Welcome!

Reunion is off the east edge of Africa, near Madagascar. It looks like a beautiful place:


What sort of elementary math do you need to understand an island half-way around the world? You need to understand time and distance, for a start.

La Réunion is a long way from the California headquarters of Excel Math. It's 12 hours ahead of our time zone .

To get there you simply fly from Los Angeles LAX airport to Paris ORY to Reunion RUN. It's 11,500 miles, more or less.


I suppose you could go the other way around (LAX to Sydney SYD to Reunion RUN), but that turns out to be a couple thousand miles further - 13,500 or so.


After time and distance, it would be helpful to be able to understand area, and circumference.

How large is Reunion?

Reunion is the 178th largest island in the world. The island is about 970 square miles or around 30 miles across. It has a circumference (coastline) of 128 miles or 207 km. (For comparison, Maui in Hawaii is 729 square miles and the Big Island is 4028 square miles.)

Here's a NASA satellite picture of Reunion next to a cyclone [click image to enlarge]. Scary, isn't it?


Come back tomorrow and we'll show you how else you can use your Excel Math elementary school mathematics to understand La Réunion.

Tuesday, March 8, 2011

How Loud and What Sound

There are many challenges facing us as quieter cars come onto the market in greater numbers. What do I mean by this?
  • Safety - since many new vehicles are almost completely silent when at rest or just starting to move, we pedestrians and cyclists won't be able to rely on our hearing to know that a car poses a danger to us.
  • Intellectual - assuming cars should produce some kind of warning noise, what kind of noise should it be, how loud must it be, at what speeds should it be broadcast, and from what location on the car should it come? What control should an owner have compared to the manufacturer? Should a local municipality, state or a nation set the sound standards?
Should cars sound like the old Jetson's flying car?


We don't want our world filled with beeping, howling, growling, shrieking noises, but we don't want to get run over, either.

Automotive News described some of the European manufacturers as designing sounds that are "futuristic" and "jet-like." Some of the tones will increase in pitch and volume as the car speeds up. The sounds are different when cars are moving forwards or backwards.

Here's the Nissan Leaf:


I think it sounds terrible, even if Nissan says they have been working for 3 years "to develop a new type of audio visibility ... for those visually-impaired." Huh? Say what? Couldn't they have said audibility? It's a perfectly suitable word we already had in the toolbox.

Some manufacturers are seeking a "brand tone" tone to audibly present their cars in the most favorable way. Just as we like a nice smell in a new car, wouldn't we be pleased if our car has the nicest sound around?

One clever entrepreneur thought to offer EVTONES, a website where he hopes future car buyers will purchase and download various "car tones" into their cars, as we do today with ringtones on our mobile phones. His site was based on some risky assumptions:
  • people will want to customize their car's noise
  • automakers will make such a system "open" to modifications (UNLIKELY)
  • safety authorities will allow changes (NOT)
  • the liability aspects of making changes will not be overwhelming (THEY WILL)
By the way, it's worth saying that this is not strictly an electric car issue, it applies to hybrids and to quiet internal-combustion vehicles too.

What does this have to do with math? Sound. Volume. Frequency. Direction. Degrees of peripheral vision. Peripheral hearing. Money. Meeting Deadlines. All involve math.
  • Hyundai delayed their hybrid in the US to take out a switch allowing owners to silence the noise, in response to a US law.
  • Nissan delayed their Leaf electric in the UK to put in a switch allowing owners to silence its noise, in response to a UK law.
If you want to read more about it:


Wikipedia article on vehicle warning sounds

The Pedestrian Safety Enhancement Act of 2010 Click the link and download the pdf file.

Monday, March 7, 2011

Don't scare me like that!

I stopped on the way to work to get gas (petrol) in my car. What did I see?


Just kidding. These are not the prices in my neighborhood! We're only paying about $4.00 per gallon, which is very high but not THAT astronomical.

"It's those oil companies getting rich! Those politicians taxing us to death!" ranted my wife.

Hmmm. Does elementary math (as taught in Excel Math curriculum) help us to understand oil prices, taxation, etc?  Just a little bit? I'd say yes.

Here is some data I got from the Energy Department:

It looks like the crude oil costs a lot but there are also some other costs that are larger. As the price of fuel oil has gone up, the percentage of the taxes and profits have gone down.

How do we compare with other nations? That's a tough question to answer, but here's a comparison I was able to assemble based on research done in Spain recently. The prices reflect averages collected around 2005-2006 and are stated in euro:


That's pretty frightening, isn't it? This is shown in cents (euro) per liter of fuel. Using some simple math, and assuming a euro is worth $1.40, we can do a more direct comparison of what we and our compatriots in the UK and Spain were paying:

USA   .51 x 1.40 (euro) x 3.78 (liters/US gallon) =  $2.70 per US gallon
UK   1.30 x 1.40 (euro) x 3.78 (liters/US gallon) =  $6.88 per US gallon
SPAIN  1.02 x 1.40 (euro) x 3.78 (liters/gallon)  =   $5.40 per US gallon

Apparently politicians can raise the taxes MUCH higher than we have so far in the USA, and it doesn't take advanced mathematics to see HOW HIGH. Virtually infinity! In the UK the tax is double the value of the fuel!

Friday, March 4, 2011

Slyly shifting sizes and prices, Part IV

Today we will start with a test. Using only the information displayed below, you must determine the subject of this blog:

Name Width Length Area
Twin
38
75
2850
Antique
48
75
3600
Full
54
75
4050
Hospital
30
80
2400
Sofa
54
72
3888
Queen
60
80
4800
E-King
76
80
6080
C-King
72
84
6048
X-Twin
38
80
3040
X-Full
54
80
4320
Water-SS
48
84
4032
Water-Q
60
84
5040
Water-K
72
84
6048

Why do we need elementary math for this subject? you may ask. But only if you've never bought one of these things!

Mattresses are a suitable topic for mathematicians because they have even more variables than cell phone plans! They are more complex than paper towels and laundry detergent, and much more expensive.

In addition to size (above) and firmness (very subjective), here are some of the constantly-shifting factors that mattress vendors juggle to complicate your next mattress purchase decision:

STEEL SPRINGS
Spring Coil Count = 252-3000
Spring Coil Type = Bonel, Offset, Pocketed, Continuous, Edge
Spring Coil Turns = 5-7
Spring Wire Gauge = 12-18
Lever-support flat springs
Swedish steel

OTHER SPRINGS
Air Pressure with pump
Polyurethane Foam
Latex Foam
Viscoelastic Foam
Water
Water plus foam or baffles or fiber-fill

PADDING
Foam
Egg-crate foam
Cotton batting
Polyester fibers
Polyurethane foam
Feathers

COVERS
Ticking Material
Pillow Tops
Washable covers
Foam Pads
Heating Elements

BED BASES
Box springs
Platform beds
Waterbed frames
Bunk beds
Bed Frames
Storage drawer frames

COMBINATIONS
Multiple materials
Left/right or top/bottom zones

ACTIVE BEDS
Adjustable bed for sitting up or raising feet
Lumbar support inserts
Massage mattress
Massage-top air pressure

OTHER
Turning regularly or non-flip
Chemicals to kill bed creatures
Flameproofing

WARRANTY
Pro-rated
Absolute

CONDITION
New
Pre-owned & reconditioned
Used

SALES APPROACH
Commission sales person with negotiating power
List price approach
"Always on Sale"
Variable Product Names between outlets

Having bought twice as many mattresses as I have houses, I can say that mattresses are harder to decide upon, but they do involve less paperwork. And having slept on more than my share of BAD mattresses when staying with family and friends, I wish we would all buy guest bedroom mattresses a little more carefully, and more often.

Thursday, March 3, 2011

Slyly shifting sizes and prices, Part III

This is the third post on how prices can be moved up and down while the contents of the package are also moving. We looked at Hershey Bars, Sun Clothes Detergent and today we'll consider paper towels. The "adjustments" that manufacturers make with towels are not too difficult for elementary mathematicians to figure out.

There are lots of kinds of paper towels - the ones you find wadded up near a sink at a public restroom, and the ones in your kitchen are the most common. I think I'll concentrate on the kitchen and leave the janitor alone today. By the way, the packaging and pricing of toilet paper is very similar to paper towels.


As seen in the photo above on the left, most paper towels fit onto a holder that stands on the counter or hangs from a cabinet. We have the hanging kind and have discovered that today's new "extra large double" rolls don't fit. (Same applies to the toilet paper!)

Here are the variables in paper:

Layers = single-ply, double-ply, triple-ply
Texture = plain, quilted, soft, abrasive, woven, perforated
Size = full (sort of square 11" x 11"), rectangular
Paper = white (bleached), brown (unbleached), new, recycled
Length of Roll or Roll Size = who knows!

Here are some packages I found:
  • 1 roll x 90 sheets x 1-ply
  • 15 rolls x 103 sheets x 2-ply
  • 24 rolls x 88 half-sheets x 2-ply
  • 24 mega-rolls x 102 sheets x 2-ply
  • 30 rolls x 51 sheets x 2-ply 
  • 1 roll x 80 sheets (11" x 9") x 2-ply quilted 60% recycled
  • 1 roll x 120 sheets (10" x 8") x 2-ply 100% recycled; 80% post-consumer
  • 30 rolls x  85 sheets x 2-ply 95% recycled; 10% post-consumer
  • 6 rolls x 140 sheets x 2-ply 100% recycled; 60% post-consumer recycled
While shopping on Amazon for paper towels I realized that another eager math-lover had done a great deal of this comparison work for me. If you want to see his analysis, you can click here.

If you want to see what a group of statisticians do when given a 4 cases of towels, read on. I have just extracted one small test. There are 14 more pages of this stuff in the actual report. Which you can easily download here. But I wouldn't advise it. Yawn.

If you just want to know which are the best towels to buy for drying your hands or wiping up a mess, sorry. I have just one piece of advice for you:

It is impossible to say at this time.