Additional Math Pages & Resources

Wednesday, August 31, 2011

Blog Post 500 - Interview and FAQ

This is my 500th posting on this math blog, in 2 years. I write about how we (grown-up people) can still productively use the elementary math we learned as children. Today I have decided to interview myself about the blog, in FAQ fashion:

How many posts do you write each week?

Assuming 2 weeks vacation time in a year, I have done 500 posts which equals 50 weeks x 5 per week x 2 years. Although I've written a few on vacation, and missed one or two days due to illness, it's come out almost even. Since I was the one doing the counting, I knew where I was and could make things work out. I have done 5 posts in 3 days this week, in order to reach 500 today.

If I say I have been writing the blog for 2 years and 20 days, that calculates as 365 + 365 + 20 = 750 days, or 2 posts every 3 days.

How do you come up with the ideas?

The hard way. I think about our curriculum; about the mathematical implications of the daily news, about life. My mind wanders a bit, and I set to work writing. Sometimes I have the images in mind first and sometimes it's the text. I suppose this is like a song-writer who has to come up with both the words and the tune.

A few people email me with ideas, or drop a note on my desk. My wife Laurie is a PE teacher, reads my blog every day, and gives me the most helpful ideas.

Where do the pictures come from?

A few graphics are linked from Internet sources. Most of the images I've posted I have either taken myself with my camera(s), or created from scratch, or extracted from our company's editorial systems and modified to suit my purpose. Here are a few for your viewing pleasure. [click on the image to enlarge]


What software do you use?

Believe it or not, doing a blog can be a complicated business. It takes a fair number of tools to build all the components of the site. I've had to teach myself a lot about Photoshop. Creating nice-looking tables in HTML and making animations were  two challenging hurdles for me. As far as software goes, I have used, in order of frequency:

  1. Firefox as my primary web browser; currently Version 6.0 for Mac
  2. Safari as my backup web browser; currently Version 5.1 for Mac
  3. Google's Blogger to create the editorial text
  4. iPhoto to manage my photographs
  5. Adobe Illustrator to create vector graphics or composite photos or single-page pdfs
  6. Adobe Photoshop to edit and adjust photographs (raster graphics)
  7. Dreamweaver to fine-tune complicated HTML code, make tables, etc.
  8. Numbers to create spreadsheets
  9. Picasa (web service) to store and serve the images to the Blogger pages
  10. Picasion (web service) to create and serve up my earliest animated GIFs
  11. Adobe ImageReady to create my recent animated GIF files (as in the recent post on charts)
  12. iMovie to edit videos
  13. YouTube (web service) to host videos
  14. Adobe Acrobat Professional to create multi-page pdf files
  15. Excel Math's website hosts some animations and other files so you can download them without me having to rely on other external sites
What hardware do you use?

I write on a white 24" iMac most of the time. I also have two Mac laptops and once or twice I managed to post from my iPhone.  In the middle of the post today I switched machines, because my iMac has been locking up for some reason. I can't edit the same post from 2 machines at the same time (but I have tried).

Do you ever lose material if the machine or network goes down?

Yes. But not often, and when I do I can often rewrite it all from memory. When it happens, groan. Once. Don't waste time kicking yourself, get back at it immediately. Creating the art again can be a pain but I seldom lose artwork.

Do you ever write more than one post in a day?

Yes, sometimes I get onto a theme, don't have too many outside distractions, and I can do 2-3 posts that develop that single theme. On a good day I can complete 2 posts, or I can do a couple rough versions and then refine them over the next few days.

Do you work far in advance?

No. I write every day for the post today (or tomorrow).  I learned writing in the newspaper business and refined my skills creating curriculum and diagnostic procedures for automotive technicians.  These editorial products go out today, tomorrow and every day. There's no acceptable excuse for not getting your assignment finished.

What about writer's block? When the words don't come to you?

I think writer's block is primarily a novelist's problem, not a technical writer's problem. Put your hands on the keyboard, move your fingers and words will appear on the screen. Then you can rewrite them. Or throw them away and start over. The key thing is to start. Again and again.

Don't you run out of subjects to write about?

Excellent question. Not yet. Consider the topic. In our elementary math curriculum we cover about 400 concepts over 7 grades and provide around 10,000 problems per grade. That's plenty of material to draw from or write about. I don't normally read through the curriculum to get my ideas, but it's always there if I need it.

Considering that I wrote a large number of those ~70,000 math problems, how hard can 500 blog posts be?

Why do this blog about using elementary math?

I enjoy math. I like figuring things out. I want other people to use the skills they have learned, and I want their kids to learn how to do math. I want people to learn about (and like) our product - Excel Math curriculum - and buy it.

Tuesday, August 30, 2011

Excel Math: The Theory

The features of Excel Math elementary school curriculum have occupied the past few blog posts. Since school is starting this week, I am focusing on the curriculum itself instead of writing about how we adults use elementary math.

I'll briefly mention the theory behind Excel Math, as it can be summarized in a few main points:
  • Direct Instruction - we believe the teacher plays a key role in passing along essential math concepts to students, using a variety of presentation methods, formats, manipulatives and activities.
  • Spiraling - concepts are introduced and variations are repeatedly presented throughout the school year. The concepts increase in difficulty, building upon one another. There is no one perfect order - we interleave them as well as we can. Here's a visual depiction of the strategy that has taken me many hours to conceive and refine. [click on the image to enlarge]


    • Repeated contact - students first encounter a new concept in the Lesson presented to them by the teacher. Then they explore it during Guided Practice with their classmates, a few times over several weeks. After this exposure, they tackle that concept on their own, in Homework. Finally, the concept appears on a Test about a month after it was first introduced. This phased approach (teacher-down; together with peers; on their own at home; on their own in a test) helps build confidence and improve mastery.
    • Self-checking - using our Checkanswer system (shown in my previous post), students can confirm that they have a good grasp of a subject. If their Checkanswer sums don't match, one of their answers in that set of problems is wrong. They go back and trouble-shoot their own work. This builds thinking patterns and work habits which support a lifetime of problem solving.
    • Practice -  students benefit from mastering a few math concepts so they can be done  automatically - such as the times tables or simple addition and subtraction. Practice helps improve our skills in math just like it helps improve a golf swing or a tennis serve. Basic Fact Practice (about a dozen problems) appears 3-4 times a week in the middle grades - it's not the much-criticized drill and kill tedium of yesteryear.
    We believe this comprehensive approach to math education helps develop thinking skills, builds proficiency, and produces confidence. Many teachers, districts and parents agree, and their students thrive.

    The individual components are supported by research, and the entire curriculum has been used with success by thousands of schools across North America for more than 30 years.  I can assure you that I personally understand math a lot better than I did a decade ago when I joined the Excel Math editorial team - thanks to working with this curriculum, and writing this blog.

      Excel Math: The Pictures

      Continuing with this week's overview of Excel Math curriculum, here are pictures of sample pages.

      We recommend home-schooling parents purchase Teacher Editions so they understand the theory, strategy and instructions for the Lesson Sheets - as well as having the correct answers, shown here in red.
      The first images are from Kindergarten and First grade. In both grades, we assume that the teacher will give verbal instructions to students who may not be reading well yet. [click on the image to enlarge]


      Here are some samples from Second and Third grades (we seem to be biased towards San Diego in the chart showing baseball games won ...) [click on the image to enlarge]


      Here are sections of Fourth and Fifth grade pages. Yes, the type is smaller and the problems are much harder! [click on the image to enlarge]


      Here's part of a typical Sixth grade lesson, with some homework on the right. [click on the image to enlarge]


      To conclude today's exposé, here are some of the variations students may encounter in our Checkanswer system. They very quickly learn to confirm their answers with this system.


      New to Excel Math? Find out more and take a quick tour of the program here.

      Monday, August 29, 2011

      Excel Math: The Words

      My last blog posting gave you some numbers about our Excel Math elementary math curriculum. As the second in a short "school is starting" series, let's look at words we use to describe the features of our curriculum:

      Lesson Sheet Consumable legal-size pages for students with content for them to interact with. We print so many million pages that the cost to customers is less than 3 cents per page image (5.4¢ per 2-sided sheet). Boxed in sets of 10, 15, 22 30 or 35 lessons, or available in tear-off pads for one student.

      NOTE: It is a violation of copyright law for schools to buy one set and duplicate the pages, and it's more expensive. We've done the math!

      Teacher Edition Approximately 500 pages of material created to introduce and support the concepts taught on the Lesson Sheets; includes an answer key. Available in coil-bound print version and in electronic form on our Projectable CD-ROM.

      Lesson An objective like "Students will multiply and divide mixed numbers" and a plan for helping them explore this concept, with examples and a few problems. Located on the Upper Front Left of the Lesson Sheet. Also available as part of our Projectable product on CD-ROM.

      Basic Fact Practice Set of problems utilizing the four basic operations (addition, subtraction, multiplication and division) for student practice. Located on the Lower Front Left of the Lesson Sheet.

      Homework Set of problems to be done at home to reinforce concepts learned in lessons 1-2 weeks prior to the homework. Located on the Right Front of the Lesson Sheet.

      Guided Practice Spiraled set of problems that review & enhance understanding of previously-taught objectives. Located on the Back of the Lesson Sheet.

      Regular Tests Set of questions to review concepts taught 1-4 weeks ago; Quarterly Tests Set of questions to review concepts from the past 35-40 lessons; Year-End Tests A pair of tests totaling 100 questions to review the entire year's concepts.

      Create A Problem Complex story problems to encourage higher-level thinking; throughout grades 2-6. Located on the back of test pages.

      Stretch Questions Brain-teaser questions and puzzles to introduce or review concepts; not directly related to the day's work. Located in grades 2-6 Teacher Editions.

      Exercises Puzzles, mazes and active learning strategies for Kindergarten and First grade. Located on the back of tests or every 5th day.

      Activities Suggestions for active learning versus lecture; daily in place of Stretches in 1st grade; 12-14 per grade in Grades 2-6. Located at the back of each Teacher Edition.

      Manipulatives Artwork for teachers to duplicate and distribute to support learning activities - such as number charts, timelines, regrouping boards, etc. Located in the Teacher Edition after Activities.

      Glossary List of words / objectives taught in one grade, with definitions and illustrations. Located in the Teacher Edition. All-grade glossaries in English and Spanish are located on our website and can be freely downloaded.

      Scope and Sequence Listing of the objectives covered by each lesson, in both subject and consecutive order. Located in the front of the Teacher Edition.

      Score Distribution Chart A set of blank chart where teachers can record, compare and present student test results without disclosing student names. Located in the front of the Teacher Edition.

      CheckAnswer  A trademarked term, employed only by Excel Math. It's a number that students use to confirm they did a set of problems correctly. Used in grades 2-6 only in Homework and Guided Practice sections of the Lesson Sheet.


      This image shows 3 problems students are asked to solve, the sum of the answers (a 4th problem), and the confirming CheckAnswer in box A.

      The next blog post will contain some more visual examples of Excel Math, and far fewer words!

      Excel Math: The Numbers

      This blog is about using math in our everyday lives. Math we learned in elementary school.

      I rarely write directly about our product (Excel Math curriculum) because you can learn about it at our main website and our online store. But this week, as many are returning to school, I think I'll share some distinctive characteristics about Excel Math. These features are obvious to me as the editor, and to many teachers who use the curriculum.

      Here are a few numbers about how we teach numbers:
      • We offer 7 grades, with 155 lessons per grade level, for a total of 1085 daily Lesson Sheets.
      • There are 794 homework assignments (124 in the 6 upper grade levels and 50 in Kindergarten).
      • Excel math includes 174 "assessment opportunities", or what most of us would call TESTS.
      • Create A Problem higher level thinking challenges appear on the back of 120 of the tests.
      • We offer 252 pages of manipulative masters that can be duplicated and used in class in lieu of counters, real clocks, etc.
      • There are 120 Activities in Grade 1, and 68 Activities split across Grades 2-6.
      Now a few more details about the numbers, calculations and discussions in Excel Math:

      We focus on numbers 0-100 in Kindergarten and First Grade, up to 1000 in Second, 1,000,000 in Third, and 1,000,000,000,000 in Fourth.

      We never do get large enough numbers for them to balance the US national budget though ... is that why we are at this point with our government finances?

      We discuss Roman numerals: I, II, III, IV, V, X, L, C, M etc. and how that number system differs from Arabic numerals.

      We talk about fractions 1/4, percentages 40%, decimals .55 and negative -13 numbers, as well as even 2 and odd 3 numbers and integers 5.

      NOTE: Spoiler Alert - in a rare breach of secrecy I am going to give away some answers! And I must say this is the first time I have looked at our products using this particular view in mind:
      The answer to the first question asked in Kindergarten is above. The last answer is 4.

      The answer to the first question in First Grade is none or zero. The last answer is blink your eyes.

      The answer to the first question in Second Grade is 4. The last answer is 15 kids.

      The answer to the first question in Third Grade is 20. The last answer is 8.

      The answer to the first question in Fourth Grade is 1432. The last answer is 269 and 263.

      The answer to the first question in Fifth Grade is 209,378. The last answer is $194.79.

      The answer to the first question in Sixth Grade is also 209,378. The last answer is $31.20.
      To conclude, here are a pair of number jokes:

      1. There are 10 kinds of people in the world - those that understand binary number systems and those that don't.

      2. The computer told me I had to choose an 8-character password, so I chose Snow White and the Seven Dwarves.

      My next blog post will focus on the words we use in our curriculum.

      Friday, August 26, 2011

      Chart(er) School, Part III

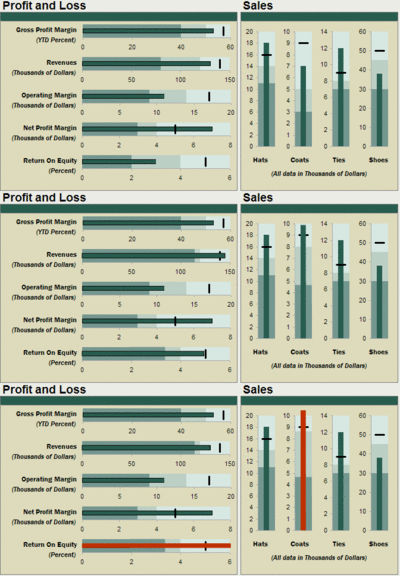
      While working on the blog posts for the past few days, I found lots of fun charts.  Here's an animated bullet chart that I created from a static image on the ExcelUser website (no relation to our Excel Math elementary curriculum):


      NOTE: My sample files are simulated charts created with a variety of software tools. I am not writing programs or macros for Microsoft's Excel or Apple's Numbers spreadsheets.

      I found a neat product called Sparklines for Excel that provides "small, intense, simple, word-sized graphics with typographic resolution ... a sparkline can go everywhere a word or number can: embedded in a sentence, table, headline, map, spreadsheet or graphic".

      Here's a complex table with numerical data plus some pie, line and bar sparklines. No animation on this one, sorry. [click on the chart to enlarge]


      While perusing the Sparkline blog I also learned about BeGraphic, a Paris-based company that produces graphical tools to animate and illuminate data. Sometimes movement catches your eye and enlightens you! Here's an example of a 6-Forces Graph, showing how a company is pulled in various directions by changes in its environment over three years:

       
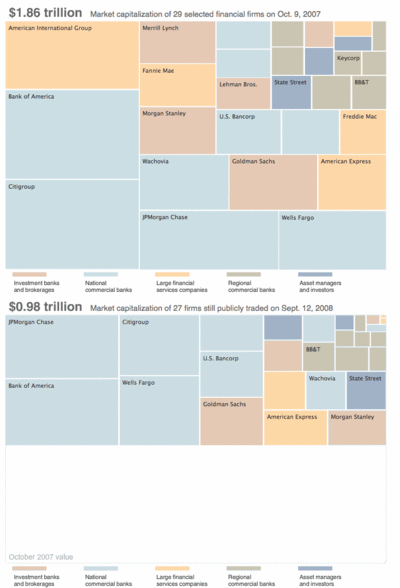
      Eventually I stumbled onto Squarified Tree Maps. You can learn more here. The graphic below is an example of a squarified map - I animated two graphs created originally by the NY Times. The size of the blocks, their position and their color contain the information about companies in the financial services business - before and after 2007's stock market crash.


      If you would like to monkey around with some data and charts, you can go over to GAPMINDER, load the World Tool, and use their global statistics to play chart-maker. I made these bubble charts to track changes in 8th grade math scores by country and per-capital income, over a period of 12 years.


      Lest you think charts are the answer to everything, wander over to Junk Charts, a highly-entertaining analysis of very bad info-graphical charts.


      Thursday, August 25, 2011

      Chart(er) School, Part II

      Yesterday I started this theme of charts and graphs. I found a number of interesting resources related to chart-making, and put up a huge list of variations. When I got home my wife pointed out that I failed to show all of the charts on my list. I made a few feeble excuses but promised her that I would create more charts today.

      These took quite a long time to assemble, so you won't get a lot of complicated math discussions out of me today. The data presented here is imaginary. This grouping is a combination of my original creations, some suggestions, and a few images that I downloaded, altered and integrated. [click the image to enlarge]


      Many of these charts are not found in academic texts that I own, but have been developed spontaneously by users looking for a way to convey meaning that can't be done with text alone.

      NOTE: Marimekko is a fabric company in Finland. Their name has been "poached" for business and the management charts where all bars are equal height, without spaces, and divided into different height segments. A "marimekko or mekko" chart vaguely resembles a Marimekko fabric.

      NOTE: In this heat map, the colors are not portraying temperature. They are showing the price of regular gasoline, by US county. The red colors are higher priced, and the green are lower. Click here to go to GasBuddy and see today's gasoline heat map.

      The name for this general field of graphic/chart -building is infographics, for Information displayed through graphics.

      Most elementary math students using Excel Math do their first charts with crayons. So it's appropriate to close today's blog with a crayon color chart. I found this at the Data Pointed blog by Stephen Von Worley. He's showing how the 8 colors in 1903 have morphed into an elaborate palette today - a very complex challenge to display visually!

      Click here for a larger, interactive version which enables you to place your cursor over a color and have the crayon color name pop up.


      Wednesday, August 24, 2011

      Chart(er) School, Part I

      OK, I admit the title is misleading. I don't mean those semi-autonomous, accountable schools.

      I mean teaching kids how to make charts that display data in a meaningful way. We do this throughout all grades of our Excel Math elementary curriculum. Here are some of the charts we help kids understand and build: [click on the chart to enlarge]


      I went on a hunt for more charts. Here's an alphabetized list of wacky charts - I just learned about many of these myself:
      1. Area chart
      2. Bar chart (horizontal or vertical)
      3. Box chart or plot 
      4. Bubble chart
      5. Bullet chart
      6. Bump charts
      7. Candlestick chart
      8. Cascade  chart
      9. Gantt chart
      10. Heat map
      11. High-Low chart
      12. Histogram chart 
      13. Horizon chart
      14. Line chart
      15. Marimekko chart
      16. Pie chart
      17. Pyramid chart
      18. Scatter chart
      19. Spread chart
      20. Step chart 
      21. Stripe chart
      22. Tally chart
      23. Tree map (squarified)
      24. Triangle chart
      25. Waterfall chart
      Once we get past our first few years of chart-making (crayons, markers, manipulatives), we tend to start using spreadsheets, where creative programmers do all the work. They allow you to click and create charts with very little effort.

      That doesn't mean you should make them without thinking, NOR does it mean that later in life when your job depends upon it, that you will find that making charts is an easy job.

      NOTE: a friend of Excel Math got an exciting opportunity a few years ago making graphics for  ESPN. Although she and her team have lots of nifty software tools, they still have to watch the sporting activities, look for trends and background data, then rapidly create charts on-the-fly to put up on the screen. A high-stress, but fun job.

      In the process of my research on this subject I found a number of interesting resources related to chart-making. Why don't you have a good look around your charting universe, and we'll meet up again tomorrow and compare notes?


      Tuesday, August 23, 2011

      More on "More for Less"

      Yesterday I did a very brief introduction to economics, from the point of view of our Excel Math curriculum. We help elementary-age kids learn to handle money, and we teach them frugality. Today I'll give you an example of the "more for less" and "less for more" concepts we introduced yesterday.

      The Apple iPhone is a popular item. The best summary I can find this morning suggests that Apple has sold about 130,000,000 iPhones globally in 4.5 years. Notice that Apple's fiscal year is different from our calendar year. The chart shows fiscal year sales.

      If the phones in the sales pipeline are sold by the end of the Apple fiscal 2011 year, the grand total will reach 150 million. I can personally account for consuming only 4 of those phones, 2 that I currently own and 2 more that I purchased but exchanged under warranty.

      This data raises many questions:
      1. Do the numbers reflect the production of phones, or the sales of phones?
      2. Do phones I returned for service get refurbished and resold?
      3. Are resold phones counted twice, or not (since I was given one in exchange)?
      4. What is the inventory in the Apple stores and other sales channels?
      5. Does everything eventually get sold?
      6. How do we count disposal of obsolete inventory?
      We'll set these typical accounting questions aside and tackle different questions instead:
      1. How can they make so many (150 million) for so little ($100-$200)?
      2. How can they sell so many (150 million) for so much ($400-550)?
      Here's a list of components of the current iPhone with my estimate of their costs in US dollars:
      • $50 Memory and processor chips
      • $40 Display and touch-screen assembly
      • $30 Misc components and packaging
      • $30 Camera, Bluetooth, Wifi, Compass, Sound
      • $20 Mechanical items (switches, jacks, plugs, cables)
      • $10 Accessories and Battery
      • $10 Production and assembly by Foxconn
      The current production cost is approximately $190. The average selling price is now about $560. So Apple keeps about $370 for concept, design, product management, advertising, sales commissions, shipping, inventory - and profit.

      Now I can try to answer my two questions:
      1. Apple makes the iPhones for so little by purchasing huge quantities of parts inexpensively along with efficient manufacturing using Asian subcontractors with low labor costs
      2. Apple sells the iPhones for so much because they make calls, provide the calendar, keep our address books, take photographs, hold our music collections, play movies, and run 402,000 apps (as of today) - things that are more cumbersome to do - and expensive - without the iPhone.
      Imagine the cost and trouble of buying separate devices (and paper) for mobile telephone, calendar, address book, camera, music player, video player, navigation system, compass, etc. etc. We know what that sum of money and trouble is - because 150 million of us were all using those techniques before we discarded them for iPhones.

      This fits in with the Labor Value philosophy, where an item's value ( when one buys, sells or exchanges it ) is connected to the toil and trouble which it can save the owner.

      Monday, August 22, 2011

      More for Less or Less for More

      Which will it be? How do we make a decision to buy?

      • Do we always want More for Less (ribeye) or do we sometimes want Less for More (filet mignon)
      • How do we help elementary school kids learn the concept of value in their math lessons? 
      • Can it be done without facing scarcity in your personal life? 
      • Do "unlimited free texting" plans undermine the concept of value?
      • Do you need hard times (a depression) before you take the following questions seriously? 
      A larger package (more) for a cheaper price (less)?
      OR
      A smaller package (less) for a higher price (more)?

      You might say "a larger package at a lower price is always a better deal" to which I can reply "not always." I suspect that the older you are and the more purchases you have made in your life (or steaks you have eaten), the more likely you are to agree that the answer is "it depends."

      Costco has a giant warehouse just down the street from Excel Math. Their strategy is "best value at the best price". Isn't value by definition a good price? If not, what is value? Is the Costco slogan redundant?  As you might suspect there are many opinions about value. Those who think long and hard about it are called economists. They formalize their opinions in economic theories:

      Intrinsic value says the price of goods and services is not a function of subjective judgement, but the object's or service's value is contained within itself. The process of producing an item, and the costs involved in creation and delivery to customers are related to the intrinsic value.

      Labor value says that the real price of everything is the work and difficulty of getting it. An item's value - when one buys, or disposes of, or exchanges it  - is the toil and trouble which it can save (the owner) or impose (on others). [Adam Smith and Karl Marx are famous for investigating this definition of value]. A shovel makes it easier to dig a hole than using one's fingers, so it is worth something to a gardener.

      AN EXAMPLE: Our state has a 10 cent deposit on many kinds of bottles. Soda and beer bottles require a deposit, but pickle jars do not. I make a personal judgement on the trouble involved in taking a bottle back to get that dime. I would rather drop them in our blue bin and let the city pick them up, or leave them for others to pick up. This opinion is not shared by my wife, who is happy to sort them, store them, and take them back in for the money.

      Subjective value suggests that an object's value (a price greater than zero) is determined by its utility at satisfying human desires. In addition, it must be in limited supply. People must want an item enough to pay more for it than someone else. An item may be able to satisfy the wants of one person more than another person. It may be useless to one person or very useful to another.

      AN EXAMPLE: To paraphrase Adam Smith - Nothing is more useful than water to a thirsty person: but you can't really buy anything with a cup of water, or exchange it for anything. A diamond, on the contrary, has hardly any "useful" value, but you can trade one for all sorts of other goods.

      Value can vary depending upon whether you plan to use the item yourself, or swap it for something else. Value can vary if consumers are using credit rather than cash - they tend to buy more with credit and may pay more for the same item. Values may go up during a natural disaster or during a "fad".

      AN LESSON IN VARIABLE VALUE: A table made of heavy wood, painted carefully, was discarded by an apartment tenant who could no longer use or transport it. The table was harvested by a "waste-not, want-not" maintenance man whose acquisition cost was minimal - just throw it in his truck. After considering the long-term cost to his family by keeping the table (more clutter in his already-over-crowded house) he carried it to the curb. We (having a much larger yard) were happy to reclaim it. Our cost was carrying it 10 houses down the street.


      When we talked to the neighbor - to be sure we could take it, he said "Yes, I got from an apartment I was cleaning out" He added, "Someone sure went to a lot of trouble to make that nice table and paint it!" and "I don't really like it or have room for it". After only a day, the value had dropped to zero.

      Click to read the inscriptions
      If we don't feel inspired by the sayings written on it, and the eccentric sequence of colored boards, I'll repaint it. My cost will go up by the time and energy we expend on the table. Eventually we will get tired of it and put it back out on the sidewalk ...

      Friday, August 19, 2011

      More for Less: Twice as Bright for Half the Power

      Math is everywhere, not just in the school classroom. If you don't know the terms and meanings of math words, you miss out on much of what's happening today.

      I recently read about a new type of hand-held computer display, called PenTile RGBW. That means Red Green Blue White


      The text of the article was filled with math words (which I have italicized). Here are a few paragraphs:

      PenTile RGBW technology gets more with less: Fewer subpixels enable columns to be one-third wider, increasing aperture ratio and transmissivity. Clear white subpixels double white light transmission in small-format, hand-held displays. Improved transmission means PenTile can boost brightness or reduce power, or enable a combination of both. The layout increases contrast for blacker blacks.

      Doubles screen brightness for equivalent power: Today's mobile devices display highly-detailed, visually-intensive content –  video, games, maps – all of which need higher brightness. Current phone displays have 200 cd/m2 of brightness and are often turned off during calls. Multimedia requires a minimum of 400 cd/m2  and the display is constantly illuminated. "Twice as bright" and “always on” shortens device battery life. PenTile enables displays to reach brightness levels necessary for today’s multimedia, without increasing the limited power budget.

      PenTile achieves high resolution with one-third fewer subpixels: Each subpixel is larger. We have higher aperture ratio – which lets more light through open areas, for resolutions of one-third MORE, using the same amount of power. Go beyond HD with thinner and lighter tablet designs. PenTile enhances the quality of white while saving considerable power for a longer time between recharging.

      As you can see, although there are few "raw numbers", the paragraphs are still full of comparative words and time and date words. Kids need to know what these words mean - thus we teach math literacy in Excel Math elementary school curriculum, as well as calculations and number manipulation.


      You might be wondering how PenTile gets blacker blacks and twice as bright for half the power with one-third fewer pixels. Or you might have dozed off, bored with this subject.

      If you are still interested, read more at DIY Calculator and learn how the display fools us into seeing more detail.  If you are snoring in class, please do it quietly ...


      Thursday, August 18, 2011

      Please Check Twice, Part II

      Yesterday I asked everyone to think like a kid taking a test in school. Check your work over before paying your bills! I know what I am talking about, because I too have mis-read and mis-paid some bills this year.

      Today we look at online bill payment. Is it easier than writing a check? Is it more accurate? Can we save paper?

      My answer: It is difficult to say at this time.

      Here is my raw data and some categories of bill paying options. To start, you have to get the bill:
      • Bill presentment (statements)
        • mail - bills are sent in an envelope to a customer's home or business
        • direct - billers interact with customers directly via email or texts to mobile phones
        • consolidator - multiple bills are delivered to a website (OnlineBank) and presented as a group to a customer


      Then you have to decide how to pay it:
        • Bill payment
          • cash - customers walk into an office and pay with cash, check or credit card
          • mail - customers send a check to a company 
          • direct - consumers pay directly at a biller’s website
          • indirect - consumers pay billers through an outside website (Quicken) or using software on a payer’s financial institution website (BillPay) or another institution (PayPal)
          • automatic (internal) withdrawal - bank makes your loan payment for a loan you have with them, from your account
          • direct debit (external) withdrawal - you authorize a company (CableTV) to take a specified amount from your bank account on a periodic basis
          • automatic renewal - when you subscribe to a magazine, you may be authorizing them to charge your credit card again on an on-going basis, prior to subscription expiration, unless you tell them not to do so. 
        One role of the educational system is to teach kids to have an open mind about changes in society - and to look for new ways to improve things. Obviously we are successful because many people are finding new ways to pay bills!

        The following are alternative ways to pay for certain kinds of purchases, but usually NOT recurring monthly bills.
        • Electronic Funds Transfer or EFT
          • transfer of funds initiated through an electronic terminal, telephone or computer to order, instruct, or authorize a financial institution to debit or credit an account, such as
            • point-of-sale transfers at a store
            • ATM (automated teller machine) transfers
            • direct deposits or withdrawals of funds
            • transfers initiated by telephone
            • transfers resulting from debit cards (but NOT credit cards)
        The following are not usually considered bill-paying activities:
        •  Online banking 
          • involves deposits, bank statements, balance inquiries, stop payments, loan applications, etc. 
        •  In Person banking
          • when you go into a branch and talk to the bank teller or officer and do your business

        That's enough about money math for now. Did you notice that even though I talked about banking the whole time, there's not a single number here?


        Wednesday, August 17, 2011

        Please Check Twice

        Excel Math is a curriculum that presents mathematics to elementary school age kids. One of the many math-related topics we cover is money. Whatever the country or language or age, money interests almost everyone.

        PAYING THE BILLS
        Today there are many ways to pay your bills - cash, check, credit card, debit card, money transfer, gift card, web bill pay, etc. There are about 100 million families in the USA, with around 175 million bill-paying bank accounts, and each family pays an average of 10 bills a month.

        We talk to kids about money and how to pay. We teach them about currency and paper money. We ask them to make change at a register. We help them develop money-handling skills, and we help them practice writing checks.We don't yet help them make purchase at the App Store or finance their school lunch accounts.

        At the same time, we (educators) are getting older and more brain-dead, leading to checks like this one I received today:

        Poorly-written check, minus the personal and account information

        A PROBLEM!
        Notice the check (which was sent to me) has $2500.00 in the amount box, but Twenty-five and no 100 in the amount line. Which is correct? Should I deposit the check? I'm quite certain the bank will pay me $25.00 and not $2500.00, but I should notify the sender first, to save us both embarrassment.

        A SOLUTION?
        I've read promotional literature for on-line payment systems which claim to eliminate mis-written checks!  

        Really?

        1. How about the on-line payment I sent last quarter for a cable bill. I sent $49.11 instead of $49.71. Darn! My fault. Where are my glasses?

        2. Let's consider the on-line payment snafu last year when I sent $100.03 to AT&T for my home phone and $39.57 to pay my iPhone bill. Same company (sort of) but wrong direction. The overpaid home bill division didn't care, but the mobile phone people objected. Rats, my fault again.

        3. I can't explain why I sent the City of San Diego the money for my water bill twice - once from home and once while on the road, because my house-sitter said "there's a bill here you should pay now" and I didn't remember having paid it before leaving on vacation. Honest, folks, I did make two payments, both in advance. Once again, my mistake.

        4. Can you imagine that a publisher might "accidentally take" a couple extra payments after I had cancelled my subscription? We caught them. This time it was not my error but theirs!

        5. 

        6.

        (5 and 6 are vacant so you can insert your own most recent mis-payment incidents)

        This happens to everyone. College graduates, math book editors, scientists, bankers, farmers - even if you are relatively good at paying all your bills - you can still make mistakes with money.

        You might hand over a $20 instead of a $10; you might use a dollar coin instead of a quarter. You might withdraw cash from your bank using your credit card instead of your debit card - and not notice until the fees appear on a statement. I'm not talking here about esoteric issues like picking the wrong stock broker or missing out on the last .10% on a Certificate of Deposit.

        I mean: Read your bills! Pay attention! Double-check your work! As you do in math class, you should do in real life.

        Non-profit agencies commonly require double-signature check systems to reduce errors and embezzlement, and large companies employ use double-signature check systems for large checks.

        Excel Math helps kids learn to double-check their own work before handing in Lesson Sheets, finishing a test, pressing SEND or putting the check IN THE MAIL.

        A double-check now beats a double check later.

        Monday, August 8, 2011

        Second Anniversary Math

        Hello and welcome to the Excel Math blog. We started writing two years ago, this week. Click here to see the first posting. Our goals for the blog are to:
        • increase exposure of our Excel Math curriculum, created long before Microsoft Excel came along
        • demonstrate how the math concepts we (or our kids) learn in elementary school can be interesting AND useful in daily life
        Today I'm looking at some of the numbers generated in pursuit of these two goals.

        THE BLOG

        I've written virtually every working day - creating 488 posts. Using division, that's 488/2 = 244 per year. I could have reached 500 if I hadn't taken some vacation along the way. So using multiplication, it's 50 weeks x 5 posts/week

        Blogger (the software I use) is provided by Google. Most of the blog's graphics and audio are stored on the Google' s Picasa site. The Picasa meter says I've uploaded 2227 images that occupy 145 mb. As a percentage, that's 14.2% of my total free space.

        Some media files are duplicates (due to editing and changes). My estimate is about 2000 images are linked from the actual blog posts. Using division and rounding, we learn 2000/488 = 4.1 images per posting.

        EXPOSURE
        If my first goal is to gain exposure, how am I doing?

        Compared to the megasites, not too well. Here are the top ten, hits-wise:
        1. Google (search, mail, etc.) 
        2. Facebook (social networking) 
        3. Yahoo (community & mail)
        4. YouTube (videos)
        5. Wikipedia (encyclopedia) 
        6. MSN (news)
        7. Amazon (commerce)
        8. eBay (auction & commercial)
        9. Twitter (social network)
        10. Bing (search)
        Considering this Excelmath blog subjest is elementary school MATH, not a new dress or video of a Frisbee-catching dog, it's doing just fine. My site monitoring meters say we've had 49,000-51,000 unique visitors. Using division, 50,000/24 = 2083 or about 2,100 a month.

        We've had visitors from 170 countries.

        The largest number of unique, first-time visitors was 251 on calendar date March 3, 2011. (Evaluating paper towels, in case you are interested - click here).

        Large numbers are part of a concept called number sense. Getting many hits on a blog is not that hard - you just write about fast cars, pretty women, your pets, getting rich quick, and the secret lives of Hollywood celebrities. But those subjects don't have much to do with elementary math.

        DEMONSTRATION
        The readers of the blog have to be the ones to judge the utility of the site. But I can say from my point of view, that it's been extremely interesting, plenty of hard work, and lots of fun as well. Here's one of my favorites.

        If you want to read some of the past postings, you have two choices -  you can search using Google for Excelmathmike (all one word) or you can use the drop-down box in the left margin and select the posts chronologically.

        CONCLUSION
        I'm on vacation this week, but I didn't want to miss this anniversary posting. Time for me to go relax in the sunshine with my cat - who doesn't care about appearing in our blog to gain me more readers! But here he is anyway.


        Friday, August 5, 2011

        Superlative Math

        Yesterday I used the term superlative when speaking of the last 3 blog posts. When I said it, I meant we were examining objects at the extreme ends of a spectrum (longest, tallest, quietest, etc.). The whole idea of comparing multiple items is a fundamental part of MATH. Even our Kindergarten Excel Math elementary curriculum starts out with comparison words.

        This morning I started researching the concept of superlative:

        DEFINITION: the highest degree attainable, meaning of the highest kind or quality; surpassing all others; supreme, extreme

        ORIGIN: The word came into English from Latin, via Olde French, about 625 years ago.

        PRONUNCIATION: soop'erluhtiv 

        HYPHENATION:  su-per-la-tive  with 11 letters and 4 syllables

        SYNONYMS: acme, height, elevation, peak, pinnacle, summit, top

        SLANG SYNONYMS: A-OK, awesome, boss, cool, fab, fantabulous, gangbusters, groovy, numero uno, No. 1, out of sight, phat, prize-winning, rad, righteous, sick, top-notch, unsurpassed, wizard

        As you may know, the superlative describes a part of our grammar. Sometimes it's hard to understand (our own) grammar, so I went over and did a lesson on superlatives at Study Spanish.com. Here's a snippet:

        GRAMMATICAL:
        We use superlatives to compare things. There are two types of superlative: relative and absolute.
        Relative: John is the smartest boy in the class.
        Absolute: John is very smart.
        The relative superlative describes a noun within the context of a group of 3 or more things:
        John is the smartest boy in the class; or Of the three, Manny is the meanest.
        The absolute superlative describes a noun that is not in the context of a group:
        John is very smart; The book is extremely expensive
        In English, a relative superlative is formed by using the word "most" or the ending "-est."
        Jose is the most intelligent boy in the class; Maria is the smartest girl in the class.
        In Spanish, a relative superlative combines an article with mas or menos then adds an adjective and de
        Juan es el chico más inteligente de la clase; John is the smartest boy in the class.
        Bill Gates es el hombre más rico de los EEUU; Bill Gates is the richest man in the US
        In Spanish, an absolute superlative may be formed in one of 3 ways - muy and adjective or sumamente and adjective or adjective and ísimo. Each of these is a little stronger than the preceding one; so -ísimo means a superlative superlative!
        muy guapo; very handsome
        sumamente guapo; extremely handsome
        guapísimo; indescribably handsome
        EXAMPLE:
        Since this is a MATH blog, I'd better end with some numbers, right? Here is a superlative table of astronomical data.

        Unit of ComparisonEarthMarsJupiterSuperlative sentence
        Planet Diameter (km)12,7606,790142,800Jupiter is biggest.
        Distance from Sun (million km)150228778Jupiter is most distant from the Sun.
        Length of day (hours)242510Jupiter has the shortest day.
        Number of Moons1216Jupiter has the most moons.
        Surface Temp. (°Celsius)22-23-150Jupiter is coldest.

        Thursday, August 4, 2011

        Quietest Places on Earth?

        Monday we saw the longest truck in America. Yesterday the tallest building in the world. Today in this series of blogs about superlatives, I'd like to investigate the quietest places on earth. I'll try to mention numbers and concepts you might need for quietness. Can elementary school math (as taught in our Excel Math curriculum) help us comprehend a lack of noise?

        Noise is measured in decibels. As with the temperature 0 degrees, 0 decibels is not equal to NO NOISE at all. It is equal to the lowest level of sound that people can commonly hear. Instruments (and some animals) are capable of hearing sounds that we cannot.

        Sound is a bit like water - it fills all the available space, it bounces around in waves, it can be deflected by a hard surface or absorbed by a spongy surface.

        I took a little survey to see what people think is the quietest place on earth:
        • My wife said the quietest place must be Carlsbad Caverns. One visitor said, "This is everyone's idea of what a cave SHOULD be: quiet, clean, dry, flat, full of fantastic formations, high ceilings, and good lighting." The contractors at the site say they ensure "Soundscape protection" by using low-noise equipment, turning all equipment off at night, and using decibel meters to monitor, measure and reduce noise impact. On the other hand, their "janitors" use special vacuum cleaners at night to remove lint from the formations next to the trail!

          • Friend A suggested Mount Whitney, at 14,505 feet elevation. Maybe, but it depends when you go. Besides the wind and the occasional aircraft, the Forest Service reports 30,000 hikers and climbers a year go to the top, and 200,000 pass through the Whitney portal, mostly in the summer - so 1500-2500 cars a day are squeezing into 300 parking places.

          • Friend B choose Antarctica. Although it is windy, and only 4000 scientists (with some of their kids) live there, it's still free of most noises. Underwater is another story. I learned about multiple sound tests near the Antarctic: blasting up to 205 decibels in Acoustic Thermometry experiments; low- and mid-frequency active sonar research with naval vessels; seismic surveys, dredging and construction; offshore wind farms, and science experiments. Go here and click on Explore to hear underwater sounds. [click on the map to enlarge it]

          • Friend C chose the Grand Canyon in Arizona, but what about the tourists flightseeing? The latest proposed noise controls still permit 364 flights a day or 65,000 flights a year over (but not within the walls) of the Canyon. This is a complex issue - we want people to enjoy the natural resources but doing so in a plane or helicopter shouldn't spoil the day for those on foot. [click on the map to enlarge it]

            • I like Anza-Borrego State Park, where 600,000 acres are protected. Although off-road vehicles are allowed in certain areas of the park, and a few planes fly overhead, it's very isolated. In the Badlands, even the terrain seems specially-constructed to absorb sound.


            I turns out we were all wrong. Have you heard about anechoic chambers? Places specifically constructed to keep noise out?

            The quietest place on earth is inside the Orfield Anechoic Chamber, up in Minnesota. (Only about 25 miles from the Road Train factory!)


            Orfield Labs has a room inside a larger room, both contained within a third room. The inner-most anechoic space is a 6-sided steel box floating on springs, inside a larger 5-sided steel box, again spring-mounted on steel beams. These chambers are within a larger room with 1-foot-thick concrete walls and ceilings. The smallest room is filled with 3.3 feet thick fiberglass acoustic wedges as shown in the photo. This inner chamber was measured at negative 9.4 dB (the lower limit for human hearing is 0 dB).

            Wednesday, August 3, 2011

            In the sky with diamonds

            Yesterday in the Excel Math blog I introduced the 400-foot-long  Perkins Road Train. It's the longest US road vehicle ever, and is currently moving a 3/4 of a million pound boiler from San Diego to Utah.

            Today we'll look at the recently-announced, kilometer-tall Kingdom Tower. I've spent a long time today gathering data that has been reported about this project. Here are some of the numbers that our elementary math students will understand, WHEN they learn the underlying concepts taught in our curriculum [the concepts are shown below in brackets like this].

            THE DEAL
            • HRH Prince Alwaleed bin Talal is building the tower; his assets are worth about 20 billion dollars [money]
            • The Prince may be the 20th richest person in the world [ordinal numbers]
            • The proposed tower would be the tallest in the world [comparative value words]
            • The tower is expected to take 63 months (about 5 years) to build [time, calendar, months and years]
            • The cost of the tower will be 4.6 billion riyal, which is US $1.23 billion, while the value of the land is 8.8 billion riyal, which is about US $2.5 billion[foreign exchange conversion; decimal numbers; money]
            • The prince's company and another firm will each have a 33% or 1/3rd interest while the contractors and another man will each take a 16% or 1/6th interest in ownership of the tower [percentages; fractions of the whole
            • Adrian Smith, the principal architect, tells us why we don't have the world's biggest towers in the United States: "tall buildings are a catalyst for developing the land around them ... the person who owns the tall buildings and the land around them will make his money off the land. The tower gives the land prestige, location and identity. One of the problems in the United States is that most super-tall buildings are in the inner city. You just can’t get that much land in the U.S. because we’re not really developing new cities."


            THE TOWER
            • The floor area of the inside of the tower will be  at least 5.7 million square feet [concept of area]
            • The tower will be at least 1000 meters (3281 feet) tall, or described in larger units, 1 kilometer (.62 miles) [distance; height; metric units; conversion]
            • The base of the tower will be about 2 square miles although it will be a triangular shape, not square [geometric shapes; area]
            • A ride to the top in one of the 59 elevators would take at least 4 minutes, if an elevator rises 1000 feet per minute [combination units; feet per minute; estimating]
            • The observation deck elevators will travel at 10 meters per second so the ride to the top will take 100 seconds, or 1.6 minutes! [metric units of velocity, time conversion]
            THE LOCATION
            • The tower will be located very close to sea level [elevation
            • The tower will be in the center of the 23-hectare (55 acre) Waterfront District [area; metric conversion]
            • The tower will be located north of the city of Jeddah, whose 4 million residents live close to the Red Sea. [large numbers ]
            • The building site's latitude and longitude are 21.733°N and 39.090°E [maps; navigation]
            MORE DETAILS

              Tuesday, August 2, 2011

              'till the wheels fall off

              Today in our Excel Math blog I'm going to take you on a trip back in your memory, AND throw a few big numbers at you, just for practice.

              Remember the hook-and-ladder firetruck? So long that you needed someone in back to steer it around corners? (Raise your hand if you always wanted to be that person driving the back end!)


              Well, this past Saturday my wife and I drove to Los Angeles and back. In San Celemente, we saw the largest, longest, wheel-iest tractor-trailer rig ever! It's a hydraulic platform trailer from Perkins Specialized Transportation in Northfield, Minnesota.

              Perkins Road Train in Oceanside, CA

              The trailer's components were hauled out here to Southern California by 9 separate trucks, then reassembled and tested. This week it's moving a 758,000-pound generator 900 miles to Clive, Utah. Once the generator is off-loaded, the trailer will be disassembled, brought back to San Diego, and reassembled to make more trips. There are 4 of these steam generators going off into storage.


              This unit features 192 tires and 48 axles - all of them able to be steered by a Bluetooth remote control. The trailer is 399.6 feet long, 20 feet wide and weighs 1.4 million pounds, loaded. It's moved by five giant 600 hp tractors - 1 pulling and 4 pushing when needed. Top speed is about 20-25 mph. They only drive at night, to avoid having problems with traffic.


              Perkins spent 2.5 years designing and building this monster load carrier - which clearly outranks the fire truck for coolness!

              If you'd like to download a 3-pg Perkins flyer explaining the Road Train, you can click here.

              This is a short video of the Perkins guys practicing turns with their trailer.

              Monday, August 1, 2011

              Balancing our Budget

              I've been posting on how we teach kids about math and money. For many reasons, we try to help them understand that spending less than what you have is the best long-term financial strategy.

              Of course, that isn't the case in all situations,. We sometimes borrow money, to (1) buy a house, (2) buy a car, (3) pay for college, etc. In the government, we borrow for major events too - building highways, paying for wars, starting off new programs before the taxes roll in, etc.

              Today our federal government is finally getting around passing a bill to balance its budget.

              Go here to download a copy of the proposal.

              If you are not a financial news analyst, you'll probably be letting someone else read it. In fact, I skimmed through its 74 pages for you, and have this to report:
              • There aren't any pictures!
              • There are lots of big words - such as sequestration
                • a. to renounce or disclaim, as when a widow appears in court and disclaims any interest in her deceased husband's estate; she is said to sequester
                • b. to take something controversial out of the possession of contending parties and deposit it in the hands of a third person; this neutral party is called a sequestor;  
                • c. denotes the act of seizing property by court order;  
                • d. the isolation of a jury from the public, or the separation of witnesses to ensure the integrity of testimony.
              • There are plenty of tricky math and money problems in the proposed law:   
                • "reduced by a dollar amount calculated by multiplying the enacted level of non-exempt budgetary resources in that account, at that time, by the uniform percentage necessary to offset the total dollar amount by which outlays are not reduced in military personnel accounts"
              • There are calculations requiring careful clockwork:
                • Two hours of debate, equally divided and controlled by the proponent and an opponent ... all debatable motions and appeals shall be limited to not more than 20 hours, which shall be divided equally between the majority and minority leaders ... any single debatable motion or appeal may not exceed 1 hour, divided equally between those favoring and those opposing. All time used for consideration of the joint resolution, including time for quorum calls and voting, shall be counted against the total 20 hours.
              • There are fancy calendar calculations too:
                • Not later than 7 calendar days (excluding Saturdays, Sundays, and legal holidays) after the date of enactment of any discretionary appropriation ... outlays for the current year, if any, and the budget year, and each outyear ... shall equal the baseline levels of new  budget authority and outlays using up-to-date concepts and definitions, minus those levels using the concepts and definitions in effect before such changes.
                  • The term ‘Outyear’ means a fiscal year one or more years after budget year; that is, further away in the future
              • We have adjustments for "emergencies", based on history:
                • DISASTER FUNDING - if during 2012 through 2021, appropriations for disaster relief [are made by Congress] the fiscal year [budget] shall be adjusted but the total is not to exceed the average funding provided for disaster relief over the previous 10 years, excluding the highest and lowest years.
                  • The term ‘emergency’ means a situation that: 
                  • a. requires new budget authority and outlays flowing therefrom, for the prevention or mitigation of, or response to, loss of life or property, or a threat to national security; and this emergency is unanticipated, ie
                  • b. sudden, which means quickly coming into being or not building up over time
                  • c. urgent, which means a pressing and compelling need requiring immediate action
                  • d. unforeseen, which means not predicted or anticipated as an emerging need
                  • e. temporary, which means not of a permanent duration
              • It's not very interesting reading, but it takes lots of concentration to follow:
                • Unless a joint committee bill achieving an amount greater than $1,200,000,000,000 in deficit reduction as provided in section 401(b)(3)(B)(i)(II) of the Budget Control Act of 2011 is enacted by January 15, 2012, the discretionary spending limits listed in section 251(c) shall be reduced ... {with} half of the total reduction calculated pursuant to paragraph (3) for that year to discretionary appropriations and direct spending accounts within function 050 (defense function) and half to accounts in all other functions (nondefense functions).
              •  Finally, there are goals and aspirations, turned into law:
                • Effective on the date of enactment of this section, for the purpose of enforcing section 201, the Chairman of the Senate Committee on the Budget shall reduce any balances of direct spending and revenues for any fiscal year to 0 (zero).
              Wouldn't seem easier to say "spend less than you take in?" That's what my grandfather told me when I was a kid, and I understood what he meant even then.