Reunion is famous for its rainfall. How much rain? you might ask. A lot! I reply. A mind-boggling amount of rain falls in the mountainous slopes of Reunion.
NOTE: in elementary math class, we teach kids to create tables like this, and how to select columns, rows, headings, units and so on to best display the data. Here I have chosen time periods, days, inches and years. The years are provided in order to emphasize that this rainfall business is not a one-time fluke!
Here are some rainfall world records held by Reunion Island:
| Period | Days | Inches | Year |
|---|---|---|---|
| 12 hour | 1/2 | 45 | 1966 |
| 24 hours | 1 | 71.8 | 1966 |
| 48 hours | 2 | 97.1 | 1958 |
| 72 hours | 3 | 154.7 | 2007 |
| 96 hours | 4 | 191.7 | 2007 |
| 240 hours | 10 | 223.5 | 1980 |
| 720 hours | 30 | 257.1 | 1993 |
| 8760 hours | 365 | 708.7 | 1993 |
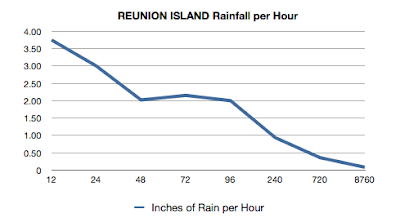
Now just for fun, let's see if we can plot these values on a graph. We derive some data points by dividing record rainfall (column C) by the hours (column A). We can now show Inches of Rainfall per Hour.
Whoops. That's not very impressive, is it? The chart is going the wrong direction - it doesn't really scare us. Let's see if I can come up with another presentation that highlights the magnitude of the rainfall.
NOTE: in math class, we teach kids how to create a variety of charts and graphs, and how to select the right chart to best display the data. Although a spreadsheet tool can "create" a graph for you, YOU need to decide what data you want to emphasize.
While I think about this, take a break for a very nice illustrated photo journal of Reunion.
======================================================================
OK, we are back and I have come up with a new way to present the annual rainfall records:
- the blue area represents record rainfall, from the data table above
- the yellow area is the average rainfall on Reunion (not shown in the table)
- the red area at bottom right is average rainfall in San Diego where Excel Math is located
[Click the chart for a larger version]
At bottom left is a touring motorcyclist with passenger drawn to the correct scale to match the rainfall!What can we learn from this? On Reunion Island you'd better check the weather before leaving the house.


No comments:
Post a Comment
Type your comment here