Additional Math Pages & Resources

Monday, December 24, 2012

Yuletide Greetings from Excel Math


Bon Natale, Feliz Navidad, Fröhliche Weinachten, Wolcum Yole, Merry Christmas!

Living Nativity, San Diego, California
In modern times, Christians all over the world celebrate the birth of Jesus Christ on Christmas, which falls on December 25 (tomorrow). This date may have been chosen to offset pagan celebrations of Saturnalia and Natalis Invicti. Some believe that celebrating the birth of Jesus, the “true light of the world” was set in synchronization with the December solstice because from that point onward, the days began to have more daylight in the northern hemisphere. Read more about the winter solstice on our previous blog post, Celebrating the Winter Solstice.

Christmas is often referred to as Yule, which may have derived from the Norse word jól, referring to the pre-Christian winter solstice festival. Yule is also known as Alban Arthan and was one of the “Lesser Sabbats” of the Wiccan year in a time when ancient believers celebrated the rebirth of the Sun god and days with more light. This took place annually around the time of the December solstice and lasted for 12 days. The Lesser Sabbats fall on the solstices and equinoxes.
The Feast of Juul was a pre-Christian festival observed in Scandinavia at the time of the December solstice. Fires were lit to symbolize the heat, light and life-giving properties of the returning sun. A Yule or Juul log was brought in and burned on the hearth in honor of the Scandinavian god Thor.
A piece of the log was kept as both a token of good luck and as kindling for the following year’s log. In England, Germany, France and other European countries, the Yule log was burned until nothing but ash remained. The ashes were then collected and either strewn on the fields as fertilizer every night until Twelfth Night or kept as a charm and/or as medicine.

This is a yule log or "buche de Noël" my daughter made for her high school French class to eat on their final day of school before the winter break. Here's the recipe. 

Christians around the world celebrate the birth of Jesus, God's Son, on Christmas day. Many churches hold special services on Christmas Eve and Christmas Day as well as on the Sundays surrounding those dates. We sing Christmas carols, add more lights to our homes, decorate Christmas trees, hang wreaths and garland, light candles, exchange gifts, and retell the story of St. Nicholas (Santa Claus).

Nicholas was born during the third century in the village of Patara, in Greece (now on the southern coast of Turkey). His wealthy parents raised him to be a devout Christian, but died in an epidemic while Nicholas was still young. Obeying Jesus' words to "sell what you own and give the money to the poor," Nicholas used his whole inheritance to assist the needy, the sick, and the suffering. He dedicated his life to serving God and was made Bishop of Myra while still a young man. Bishop Nicholas became known throughout the land for his generosity to people in need and his love for children. St. Nicholas' feast day on December 6th is the main day for gift giving and celebrating in much of Europe.

In the Netherlands St. Nicholas is celebrated on the 5th, the eve of the day, by sharing candies (thrown in the door), chocolate initial letters, small gifts, and riddles. Dutch children leave carrots and hay in their shoes for the saint's horse, hoping St. Nicholas will exchange them for small gifts. Here in the United States, children sit on Santa Claus' lap and let him know what gifts they would most like to receive when he arrives with his sleigh and reindeer on Christmas. Many stories and legends have sprung up around St. Nicholas. Read more at StNicholasCenter.org.

However you celebrate this special season, we wish you and your family a Merry Christmas and a Joyeux Noel!

New to Excel Math? Learn more on our website: www.excelmath.com

Friday, December 21, 2012

Celebrating the Winter Solstice

December 21 marks the winter solstice this year, the date thought by some to have been forecast as the end of this age by the Mayas who had remarkably accurate lunar and solar calendars.

However, in March 2010 a team of archaeologists from Boston University discovered a portion of a wall in Xultún, once a sprawling Maya city-state in northern Guatemala. Little did they know that the wall held never-before-seen paintings and an ancient Maya calendar. With the discovery of this new calendar, those speculations about today being predicted as the end of this age are largely put to rest. The markings on this wall suggest dates thousands of years in the future. Read about the discovery of the oldest known Maya Calendar on our previous blog post.

The solstices are the results of Earth's north-south axis being tilted 23.4 degrees relative to the ecliptic, the plane of our solar system. This tilt causes different amounts of sunlight to reach different regions of the planet during Earth's year-long orbit around the sun.

The December solstice occurs when the sun reaches its most southerly declination of -23.5 degrees. In other words, it is when the North Pole is tilted 23.5 degrees away from the sun. Depending on the Gregorian calendar, the December solstice occurs annually on a day between December 20 and December 23. On this date, all places above a latitude of 66.5 degrees north (Arctic Polar Circle) are now in darkness, while locations below a latitude of 66.5 degrees south (Antarctic Polar Circle) receive 24 hours of daylight.

Use this Sunrise and Sunset calculator to find the number of daylight hours during the December solstice in cities worldwide. Here's a gorgeous sunset over the Big Island of Hawaii at Kona. What time does the sun set today in your part of the world?

Another fun web page is the Seasons Calculator – See when seasons start around the world through the year 2049.
The sun is directly overhead on the Tropic of Capricorn in the southern hemisphere during the December solstice. It also marks the longest day of the year in terms of daylight hours for those living south of the equator. Those living or travelling south from the Antarctic Circle towards the South Pole will see the midnight sun during this time of the year.
For those of us in the northern hemisphere, the December solstice marks the day of the year with the least hours of daylight. People living or traveling north of the Arctic Circle towards the North Pole will not be able to see the sun during this time of the year.

December 20 and December 23 solstices occur less frequently than December 21 or December 22 solstices in the Gregorian calendar. The last December 23 solstice occurred in 1903 and will not occur again until the year 2303. A December 20 solstice has occurred very rarely, with the next one occurring in the year 2080.

In Excel Math, students learn about the Gregorian calendar. Here's a worksheet showing an easy way to remember which months of the year have 31 vs. 30 days (except February, which has 28 or 29 in a leap year). Click here to download this worksheet. Learn more about Excel Math on our website: www.excelmath.com.
Click here for a larger view.

Here in San Diego, the winter solstice marks a popular time of year to hike Cowles Mountain (pronounced "coles"), part of Mission Trails Regional park. From the eastern horizon, at dawn on the days surrounding the solstice, a peak splits the rising sun so it appears for a short time to be divided in two. This part of the mountain was a Kumeyaay Winter Solstice observatory site. You could see hikers start up the mountain with their flashlights before dawn this morning to watch this amazing sight. Read more about hiking up Cowles Mountain on our February 2, 2012 blog post, Take a Hike.

New to Excel Math? Visit our website to learn more and take a look at sample lessons: www.excelmath.com.

Monday, December 17, 2012

Excel Math Assessments

Recent surveys indicate that teachers have lost faith in assessments and doubt that standardized tests in some cases accurately reflect students' achievement. W. James Popham, an assessment expert who serves on the Smarter Balanced technical-advisory committee, said tests can provide meaningful information only if teachers and students get more fine-grained feedback than an overall score in writing or in math “concepts and procedures.”

“It’s still too broad,” he said. “No one can ferret out what students need help with. For Smarter Balanced to make a real contribution, it has to make certain that its other two pieces, the interim and formative assessments, are instructionally focused, so educators can do something with the results.”
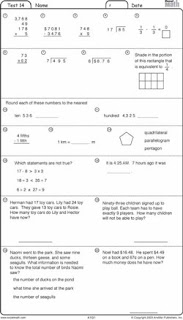
Test Table from Excel Math Teacher Edition
Click here to see a larger image.

Excel Math assessments give teachers fine-grained feedback with tables in each Teacher Edition to show which concepts are addressed by each test question and where those concepts are first taught in each Excel Math grade level. So when a student or class misses a certain test problem, the teacher can go back to the lesson where that concept was first introduced and reteach or review it with the students. In addition, the spiraling process and spaced repetition of concepts means that mastery does not occur the first time a concept is introduced. Rather, concepts are reviewed regularly to help students achieve long-term mastery and gain confidence in their math skills.

With Excel Math assessments, teachers not are not only getting data for future instruction (and can see where more review needs to happen and which concepts need reinforcement or clarification), they are also measuring the results of past instruction. With these results, teachers can fine-tune their teaching methods and focus on specific concepts to best meet the needs of the students in each classroom.

Experts now say the transition to the Common Core State Standards could bring better high-school assessments that more accurately depict achievement. Under the common core, states are expected to adopt "longer, more thoughtful exams," said David Coleman, president of the College Board. However, officials say they are still working to determine what length is feasible. Read more at U.S. News & World Report/High School Notes.   

Regular assessment is already built into Excel Math curriculum. There is a test after every five lessons. Tests are cumulative. A table in the Teacher Edition shows the test questions and in which lesson each concept was originally introduced. So if a student misses a problem on the test, the teacher can see at a glance which lesson or concept to review with the student.

Each week, new concepts are introduced to the students. At the same time, old concepts are reinforced and practiced as students prepare for assessment a week later. Students are not tested immediately after learning a concept. They have ample time to practice what they have learned—in class and at home, in calculation and in word problems. Excel Math also includes quarterly tests and end-of-year tests.

The Excel Math Score Distribution Chart combined with the test tables mentioned above are included in each Excel Math Teacher Edition. These assessment tools can help the teacher see at a glance where the class as a whole is having trouble grasping concepts and where students need individual help to achieve mastery. Download your free chart here: www.excelmath.com/usingexcel/record_keeping.html. Instructions are included.
Another assessment tool created by Excel Math, are the easy-to-use placement tests, available in English and Spanish.

Use these Placement Tests to determine where a student should start in the Excel Math program. Each Placement Test file contains six tests that evaluate a student's preparedness for Excel Math.

The tests are labeled A - F, which correspond to first through sixth grade. The test questions review the prior year's work. Successful completion of each test shows readiness for that grade level. Instructions for using the tests are included.

New to Excel Math? Learn more on our website, www.excelmath.com. For tips to getting started with Excel Math, visit www.excelmath.com/go.html.

What are your feelings about assessments and standardized tests? Leave us a comment below.

Wednesday, December 12, 2012

The 12 Days of Christmas

Since today's date is 12-12-12 and Christmas is fast approaching, I was reminded of the song, The 12 Days of Christmas. Our family has a brightly-illustrated picture book with the song lyrics that we enjoy reading over again this time of year.

The 12 Days of Christmas is a favorite Christmas carol. There are versions with motions that make it a fun counting song to do with children. We start singing it after Thanksgiving and continue through to Christmas, but the twelve day of Christmas actually refers to the 12 days after Christmas. These are the 12 days between Christmas (the day celebrated as Jesus' birth) and Epiphany (when the wise men  arrived at the home of the little child Jesus).

The poem mentions gifts given on each day over a twelve-day period. The letters in parentheses indicate the abbreviation we'll use for each gift:
On the first day of Christmas, my true love gave to me a partridge in a pear tree (p).
On the second day of Christmas, my true love gave to me 2 turtledoves (t) and a partridge in a pear tree.
On the third day of Christmas, my true love gave to me 3 french hens (f), 2 turtledoves and a partridge in a pear tree.
On the fourth day of Christmas, my true love gave to me 4 calling birds (c), 3 french hens, 2 turtledoves and a partridge in a pear tree.
On the fifth day of Christmas, my true love gave to me 5 gold rings (gr, 4 calling birds, 3 french hens, 2 turtledoves and a partridge in a pear tree.
On the sixth day of Christmas, my true love gave to me 6 geese a-laying (gl), 5 gold rings, 4 calling birds, 3 french hens, 2 turtledoves and a partridge in a pear tree.
On the seventh day of Christmas, my true love gave to me 7 swans a swimming, 6 geese a-laying, 5 gold rings, 4 calling birds, 3 french hens, 2 turtledoves and a partridge in a pear tree.
On the eighth day of Christmas, my true love gave to me 8 maids a milking (m), 7 swans a swimming, 5 gold rings, 4 calling birds, 3 french hens, 2 turtledoves and a partridge in a pear tree.
Now that you get the idea, we can skip ahead to the gifts given on the twelfth day:
On the twelfth day of Christmas, my true love gave to me 12 drummers drumming (dd), 11 pipers piping (pp), 10 lords a leaping (ll), 9 ladies dancing (ld), 8 maids a milking (m), 7 swans a swimming (s), 5 gold rings (gr), 4 calling birds (c), 3 french hens (f), 2 turtledoves (t) and a partridge in a pear tree (p).
The first day the true love gives a gift of a partridge in a pear tree. The second day's gifts include another partridge and tree plus two turtledoves. The third day brings yet another partridge and pear tree, two turtledoves, and three french hens. By the end of the 12 days, the poor lover has received 12 partridges in pear trees, 22 turtledoves, 30 french hens, etc.  It sounds like a zoo (literally). Can you figure out the total of each item given by the end of the 12-day period?

Each day, a new gift is given, plus all the gifts from the previous day are given once again. We can put together a mathematical equation to represent the total gifts, using the abbreviations shown above for each gift: 12p + 11(2)t + 10(3)f + 9(4)c + 8(5)gr + 7(6)gl + 6(7)s + 5(8)m + 4(9)ll + 3(10)ld + 2(11)pp + (12)dd


Excel Math gives students a strong foundation of elementary math so they can build solid math skills and develop a love for math. Learn more about how it can work for your students at www.excelmath.com.


Now back to our twelve days of Christmas math. The first number indicates the days the gift was given (12 days for the partridge, 11 for the turtledoves, etc.) and the number in parentheses indicates the quantity of that gift given each day (1 partridge, 2 turtledoves, 3 french hens, etc.) Over the 12 days of Christmas, the true love would give:
12 partridges and pear trees
22 turtledoves
30 french hens
36 calling birds
40 gold rings
42 geese laying eggs
42 swans
40 maids and cows
36 lords
30 ladies dancing
22 pipers with pipes
12 drummers with drums

Notice the pattern. There are 12 each of partridges and drummers, 22 each of turtledoves and pipers. So the easiest way to count the gifts is to add the first half of the list and then multiply it by two:
12 + 22 + 30 + 36 + 40 + 42 = 182
182 x 2 = 364
There are a total of 364 gifts given in this song (not counting the additional items such as pear trees, drums, pipes, cows, etc.)

If you'd like to hear a new slant on this old favorite, you might enjoy "The 12 Days After Christmas" written by Frederick Silver in 1968. It begins, "The twelve days after Christmas, my true love and I had a fight. And so I chopped the pear tree down and burned it just for spite!" Listen to the Desert Chorale perform the song:

Then download the sheet music (http://www.musicnotes.com/sheetmusic/mtdFPE.asp?ppn=MN0089151) for a fee and sing it through yourself for a good laugh (you can even transpose it to the key of your choice).

Whichever version you prefer, take some time to enjoy this once-in-a-lifetime day of 12-12-12. Sit back, relax, and read one of the following books about twelve:
The Twelve Days of Christmas
The Gershwins and Me: A Personal History in Twelve Songs
Twelve Angry Men
Polar Bears Past Bedtime (Magic Tree House #12)
Twelfth Night
The Labours of Hercules: Twelve Hercule Poirot Mysteries
The Twelve Tribes of Hattie
New to Excel Math? Learn more and download samples on our website: www.excelmath.com.

Monday, December 10, 2012

The Eight Days of Hannukah: Counting Worksheets

Hanukkah or the "Festival of Lights," also known as Chanukah, began on Saturday, December 8 and continues through December 16 this year. The eight-day festival commemorates the rededication of the Second Temple in Jerusalem during the second century B.C.

According to legend, Jews had risen up against their Greek-Syrian oppressors in the Maccabean Revolt. Afterward, Judah led his followers to cleanse the Second Temple, rebuild its altar and light its menorah (pictured above, under the Hebrew letters). The gold candelabrum had seven branches representing knowledge and creation. Its candles were intended to be kept burning every night. Today Hanukkah menorahs have 8 branches plus one servant light. The servant candle lights the other 8 candles. The eight days and nine candles of Hanukkah give us an opportunity to use counting along with addition and subtraction in a fun multi-cultural lesson.

For over 35 years, Excel Math has provided teachers (Kindergarten through Grade 6) with proven lessons that help students excel at mathematics. Learn more and watch Excel Math in action at www.excelmath.com. Read some Excel Math success stories at excelmath.com/about/successes.html. Now back to Hanukkah.
Dreidel (wooden toy)

Hanukkah means "dedication" in Hebrew. It begins on the 25th of Kislev on the Hebrew calendar and usually occurs in November or December. According to the Talmud, one of Judaism’s most revered texts, Judah Maccabee and the others who took part in the rededication of the Second Temple witnessed a miracle. Even though there was only enough olive oil to keep the menorah’s candles burning for a single day, the flames continued for eight nights, giving the people time to find a fresh supply. This amazing event inspired them to proclaim a yearly eight-day festival.

Each day during Hanukkah, children receive presents, and a candle on the Menorah is lit. Traditional Hanukkah foods are fried in oil. Potato pancakes (known as latkes) and jam-filled donuts (sufganiyot) are popular in many Jewish households. Other Hanukkah customs include playing with four-sided spinning tops called dreidels, exchanging gifts and singing Hanukkah songs.

Read more about Hanukkah traditions at http://www.history.com/topics/hanukkah. Download a counting worksheet showing candles on a Menorah:


If your students celebrate Christmas or Kwanzaa, download the blank candles worksheet and have them draw a wreath or a Kinara (Kwanzaa candle holder) beneath the top candle. Students who don't celebrate holidays can simply draw a fireplace mantel or table (or candle holders of their choice) beneath the candles. Have your students print their names in the box at the top and cut out the candles on the bottom of the page. For Kwanzaa, let students color the candles red, black and green before cutting them out. You will only need 7 candles for Kwanzaa. Point out that there is already one candle on the Menorah (or Kinara or wreath):

Then ask, "If you add two more candles, how many will you have on the Menorah?" (3) Let your students add two more candles to the Menorah. Continue until all the candles are glued to the Menorah. Then show your students how to slide the paper strip through the slits to cover the candle flames. Let them slide the strip the other way to uncover some of the flames. Ask them how many candles are on the Menorah. (9) Ask them how many candles will be lit if they cover 5 flames. (4) Have them cover 5 flames to check. Continue in this way using addition and subtraction.

You can also use this worksheet to help your students recognize left and right. Ask each student to put a finger on a candle to the right of the center candle. Do the same with a candle to the left of the center candle (the tall one is the center). Then have them use the paper strip to cover two flames on the right of the center candle. Let your students make suggestions for additional math problems or story problems about the candles.

How do you help your students relate math to customs and traditions? How do you help them see math in everyday life? Leave a comment below with your teaching suggestions.

New to Excel Math?  Find out more on our website: www.excelmath.com.

Wednesday, December 5, 2012

Math Lessons: Thinking Outside the Textbook

Louisiana state education officials say new textbooks do not match up with the Common Core State Standards. (Read the full blog post here.) As a result, they are thinking about rejecting proposed textbooks from publishers submitted for the most recent adoption cycle. Among the textbooks specifically cited for insufficient common core alignment were math books geared for students in K-2. Here's where Excel Math can help fill the gap.

One of the great benefits of Excel Math is that it is continually enhanced. We print Excel Math throughout the year so teachers always have the latest lesson sheets, unlike textbooks, which are static until you buy a new book. Over the years, Excel Math has been updated with new teaching tools, but the proven math teaching techniques, in-depth spiraling, the CheckAnswer feedback loop, and other time-tested benefits of this program have not changed.

Excel Math Gives Your Students More
Excel Math uses proven instruction strategies in the Daily Lessons that include:
Daily Instruction of specific concepts
Basic Fact Practice (including online timed practice)
Guided Practice
Critical thinking activities
Interactive manipulatives
Challenging story problems
Stretches (brainteasers)
Projectable lessons (interactive way to engage the class using an electronic format)
Preprinted lesson sheets (students don't need to waste time copying problems)

Formal assessment is incorporated into the Excel Math program and is organized into weekly, quarterly, and year-end tests. Our unique spiraling strategy ensures that students are not tested on concepts that have just been taught. Instead, concepts are introduced and then reviewed and practiced before they are included on tests. In addition, concepts spiral back into the lessons on a regular basis so students are able to retain them for the long term.

Built into this structure are powerful self-checking feedback loops that keep students on task and engaged. Students can work independently, catching mistakes as they occur and correcting them before moving on. They are given the opportunity to build higher-level thinking skills through hands-on activities, Create-A-Problem stories, stretches, and more. These varied activities extend opportunities for differentiated instruction and let teachers merge math with literacy. Mastery is achieved over time by exposing students to concepts and then using spaced repetition to keep those concepts revolving back to the forefront, helping students gain complete understanding.

Excel Math Lessons Correlate with Common Core
Click here to see correlations
We were pleased, but not surprised at how well our Excel Math materials correlate to the Common Core and new state standards. Take a look for yourself. View and download the correlations by grade level. Simply click on the grade level button to see the correlation between that set of educational standards and Excel Math. With Excel Math, students learn higher-order thinking skills beyond what is required of the Common Core. Our correlations allow you to focus on the standards or go even further, with additional concepts we provide.

Within each grade level, we correlate the Excel Math Lessons, Stretches, Activities and Exercises to each Common Core standard. At the bottom of each Common Core (CCS) correlation, we list additional concepts covered by Excel Math. You can use these additional concepts to provide accelerated learning for your students who are ready for more.

This year we added some Common Core activities to our Excel Math lessons to expand on those concepts already included in the Excel Math Teacher Edition, Student Sheets and Projectable CDs. Click here for our Tools for Teachers and these new lesson pages (available for viewing and download as PDF files).

Does Your Curriculum Need a Boost?
If you're not already using Excel Math, why not? Excel Math is proven as a core curriculum and also helps increase student test scores in a supplement position. Even though most textbooks don't meet or correlate to the new Common Core Standards, Excel Math correlates and even goes beyond CCS requirements. Projectable lessons let your flip your class or use an electronic whiteboard (or just a screen) to engage the entire class in learning.
 
Why sink large amounts of money into textbooks or programs that don't achieve the necessary results but can become a huge financial drain?  Excel Math is extremely affordable and it really works. Students gain confidence as they achieve mastery and really begin to understand and enjoy mathematics. Excel Math Professional Development is also available for a nominal fee. (Read more about hosting a PD session at your school.)


Excel Math Really Works
Excel Math works equally well for remediation and resource students as for GATE and more advanced students. These unique lessons for K-6 can help teachers transition to the Common Core and new state standards, building student confidence in the near term and advancing students with proven test results and reasonably priced materials that really work in the math classroom. Excel Math solves some of the problems faced by educators and provides an excellent program supporting the needs of students and teachers alike.

Excel Math is a rigorous curriculum that results in skill mastery, long-term retention of concepts and advanced understanding. Students progress significantly in math skills and aptitude, preparing them for higher level math courses in middle school, high school and college and helping them succeed in the workforce.

Download our "Top 10 Reasons Your Students Will Thank You for Using Excel Math."
Click here for a larger view

New to Excel Math? Read more on our website: www.excelmath.com

Monday, December 3, 2012

Amicable Numbers: Can't We All Get Along?

The dictionary defines amicable as "having a spirit of friendliness." It comes from the Latin word amicus, meaning "friend."

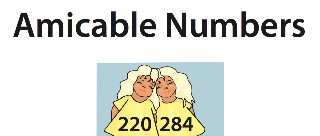
Mathematicians say that two positive integers are amicable or friendly if each of them is equal to the sum of all the proper divisors of the other, including 1. Proper or aliquot divisors are all the positive divisors of a number, excluding the number itself. The numbers 220 and 284 are called amicable.

Take a look at the proper divisors of these two numbers:

       220                              284
    Divisors                       Divisors

  1    (220)                    1            (284)
  2     110                     2             142
  4       55                     4               71
  5       40                    
10       22                    
11       20

When we add together the proper divisors of 220 (1, 2, 4, 5, 10, … , 110) we get the other number (284). Likewise, the sum of the divisors of 284 (1, 2, 4, 71, 142) is equal to the first number (220). Each amicable number has the power to generate another, thus symbolizing mutual harmony, perfect friendship and love.

The amicable numbers were thought by mystics to possess magical powers. Astrologers used these numbers for preparing talismans and horoscopes. They believed that amicable numbers had the power to create special ties between individuals. They also saw these number pairs as symbols of friendship.

Antreas P. Hatzipolakis quotes Mathematical Magic Show by Martin Gardener (Viking. London 1984): 
The Pythagorean brotherhood regarded 220 and 284 as symbols of 
   friendship. Biblical commentators spotted 220 in Genesis 32:14 as 
   the number of goats given Esau by Jacob. A wise choice, the 
   commentators said, because 220, being one of the amicable pair, 
   expressed Jacob's great love for Esau. During the Middle Ages this 
   pair of numbers played a role in horoscope casting, and talismans 
   inscribed with 220 and 284 were believed to promote love. (p. 167) 

Read more on the MathForum.org.

For over a thousand years, only this first pair (220 and 284) was known. It was attributed to the philosopher Iamblichus (c.250-330), who credited Pythagoras. Eventually, the mystical quality of amicable numbers caused them to be studied more carefully by number theorists.

The next amicable pair (17,296 and 18,416) was probably discovered in the 9th century by Arab mathematician Thabit ibn Qurra. In 1636, Pierre de Fermat rediscovered this pair. Later, René Descartes discovered a third pair: 9,363,584 and 9,437,056.

Then, in 1747, Leonhard Euler published a short paper [E100] mentioning the technique that Descartes and Fermat had used, and listing 30 amicable pairs, including the three already known, and including one “pair” that was not actually amicable.

A total of 59 pairs were found by Euler, among them the pair (6,232 ; 6,368) and the pair (10,744; 10,856). B.N.I. Paganini, a sixteen-year-old Italian youth, startled mathematicians in 1866 when he found a smaller, overlooked pair of amicable numbers: 1184 and 1210. In 1946 E. Escott wrote a long paper dedicated to the amicable numbers, offering an inventory of 390 amicable pairs. By 1999 there were over 450,000 pairs of amicable numbers and by 2007 there were over 11 million pairs. Here are just a few:


Pythagoras when asked, "What is a friend?" replied that a friend is one "who is the other I" such as 220 and 284. The numbers 220 and 284 form the smallest pair of amicable numbers (also known as friendly numbers) known to Pythagoras.

Amicable numbers serve no practical purpose, but professionals and amateurs alike have enjoyed uncovering them and exploring their properties. This chart lists all amicable pairs under 1014.

Read more about amicable pairs on the following websites: http://www.shyamsundergupta.com/amicable.htm
http://primes.utm.edu/glossary/xpage/AmicableNumber.html


Here at Excel Math, we have an atmosphere of friendliness and a very amicable workplace. When you call us (1-866-866-7026) between the hours of 8:00 a.m. and 4:30 p.m. West Coast time, a friendly person will answer the phone, never a machine.

New to Excel Math? Learn more on our website www.excelmath.com. Watch this video to see how Excel Math works:

Visit our website for more videos and resources: www.excelmath.com.

Wednesday, November 28, 2012

Mapping Out the Compass Rose

The compass rose has appeared on charts and maps since the 1300's when the portolan charts first made their appearance. The term "rose" comes from the figure's compass points resembling the petals of a rose. Can you see the resemblance?


Originally, the compass rose was used to indicate the directions of the winds (and it was then known as a wind rose), but the 32 points of the compass rose come from the directions of the eight major winds, the eight half-winds and the sixteen quarter-winds. Each point is indicated by degrees, with 0º for North, 90º for East, 180º for South and 270º for West.

The 32 points are therefore simple bisections of the directions of the four winds (but the Chinese divided the compass into 12 major directions based on the signs of the Zodiac). North is usually at the top, and each direction is abbreviated using its first letter (N for North, E for East, etc.)

The compass rose above is divided into subsections so NE is northeast, NNE is north-northeast, NbE is north by northeast, etc. One of the first things western apprentice seamen had to know were the names of the points.

Here are some simpler but very colorful versions of the compass rose:

Read more . . . 

New to Excel Math? Learn more and download samples on our website: www.excelmath.com.


You may also like these articles:

Monday, November 26, 2012

Fibonacci's Spiral and Excel Math

Today we'll take a look at the Fibonacci spiral and rectangle. Fibonacci, or more correctly Leonardo da Pisa (also called Leonardo Bigollo), was born in Pisa, Italy in 1175. He travelled widely in Barbary (Algeria).

In 1200 he returned to Pisa and used the knowledge he had gained on his travels to write Liber abaci.

Read more about Fibonacci on our previous blog posts:
Fibonacci: 810 Years of Mathematical Magic and
Celebrating Fibonacci Day

The famous Fibonacci sequence is as follows:

1, 1, 2, 3, 5, 8, 13, 21, 34, 55, 89, 144, 233, 377, 610, 987, ...

where the first two numbers of the series are 1 and 1 and each number afterward is defined as the sum of the two previous terms, Fn = Fn - 2 + Fn - 1. (Though in Fibonacci's sequence the first number was 1 and the second number was two, the first one was assumed.)
We can make a picture showing the Fibonacci numbers 1, 1, 2, 3, 5, 8, 13, 21... if we start with two small squares of size 1 next to each other. On top of both of these draw a square of size 2 (= 1 + 1).

We can now draw a new square—touching both a unit square and the latest square of side 2—so having sides 3 units long; and then another touching both the 2-square and the 3-square (which has sides of 5 units). We can continue adding squares around the picture, each new square having a side which is as long as the sum of the latest two square's sides. This set of rectangles whose sides are two successive Fibonacci numbers in length and which are made up of squares with sides which are Fibonacci numbers, we will call the Fibonacci Rectangles.

fibspiral2.GIFHere is a spiral drawn in the squares, a quarter of a circle in each square. The spiral is is made up of fragments which are parts of circles and does not go on getting smaller and smaller) but it is a good approximation to a kind of spiral that does appear often in nature. Such spirals are seen in the shape of shells of snails and sea shells and in the arrangement of seeds on flowering plants. The spiral-in-the-squares makes a line from the centre of the spiral increase by a factor of the golden number in each square. So points on the spiral are 1.618 times as far from the centre after a quarter-turn. In a whole turn the points on a radius out from the centre are 1.6184 = 6.854 times further out than when the curve last crossed the same radial line.

This golden ratio 1·618034 is also called the golden section or the golden mean or just the golden number. It is often represented by a Greek letter Phi. The closely related value which we write as phi with a small "p" is just the decimal part of Phi, namely 0·618034.

This is an image of a Nautilus sea shell. You can see the spiral curve of the shell. The internal chambers that the animal using it adds on as it grows. The chambers provide buoyancy in the water. Now draw an imaginary line from the center of the shell out in any direction and find two places where the shell crosses it so that the shell spiral has gone round just once between them. The outer crossing point will be about 1.6 times as far from the centre as the next inner point on the line where the shell crosses it. This shows that the shell has grown by a factor of the golden ratio in one turn.


This mathematical spiral can also be seen in music. According to a recent article in the Wall Street Journal, Debussy worked in spirals. "Musicologists have detected evidence of spiral-like mathematical structures in this music, related to the Fibonacci sequence and the Golden Mean."

Read more at Ron Knott's web site: Fibonacci Numbers and the Golden Section.

Excel Math uses a spiraling strategy similar to that found in the nautilus shell. This unique spiraling strategy introduces new math concepts to students while reviewing previously-taught concepts. It gives students the opportunity to master the old through spaced repetition, while being challenged with the new. Once a concept is introduced, it literally stays in front of the students for the rest of the school year. The spiraling strategy of repeating concepts at regular intervals throughout the curriculum is an integral part of Excel Math.

This spiraling strategy is a sophisticated process of introducing new concepts, reinforcing the concepts regularly, and then assessing the concepts. It leads to mastery and long-term competency for each student. In other words, the spiraling strategy helps move new concepts into the child's long-term memory and keep them there. Read more on our previous blog post: Spiraling Into Control.

Excel Math curriculum continually brings in new topics while refreshing math concepts the students have learned before. Students aren't tested on a subject until they've had multiple chances to succeed in Guided Practice and Homework. Here's a visual road map explaining this spiraling strategy:

Constant review and spaced repetition of the math concepts ensure students remember those concepts long after they are first introduced. Lessons build upon previous learning and often blend math and literacy, producing well-rounded and confident students. To learn more, visit the Excel Math website.